
Deworming and decay: replicating GiveWell’s cost-effectiveness analysis
Summary
At the Happier Lives Institute, we have been replicating GiveWell’s cost-effectiveness analysis of deworming. GiveWell’s model assumes that the economic benefits of deworming last for 40 years with no decline over time. We noticed that this assumption conflicts with the data from the main deworming study that GiveWell uses (Hamory et al., 2021). When we looked at the effects over time, we found that the economic benefits decay by around 12% each year. Taking this decay into account shrinks the total economic benefit by 60% compared to GiveWell’s model. This would reduce the cost-effectiveness of nearly all their recommended deworming charities below their 10x bar for funding. For more details about our calculations, the data used, the choice of the decay model, and its implications for the GiveWell deworming charities, see our external appendix.
We raised this issue with GiveWell1We presented our calculations and spoke with a GiveWell staff member. We also notified them that we were planning to publish some notes about our conversation.. They said that they are aware that the data suggests a decay over time, but they think their model is more appropriate; they noted that they haven’t explained and defended this choice publicly. In conversation, they gave two reasons for their approach. First, they have strong prior beliefs about the effects over time. Second, they have already applied a conservative discount to deworming.
In this post, we provide the context for our analysis and why we estimate a decay of economic benefits. We then attempt to reconstruct GiveWell’s reasons and explain why we find these reasons unconvincing. Finally, we provide four recommendations to improve the clarity and transparency of GiveWell’s cost-effectiveness analyses. These are to (1) publicly explain and defend their assumptions about the effect of deworming over time; (2) explain their cost-effectiveness analyses in writing; (3) illustrate the sensitivity of their results to key parameters; (4) make it clear when an estimate is subjective or evidence-based.
1. How we discovered the discrepancy between the data and GiveWell’s model
The Happier Lives Institute is searching for the most cost-effective ways to increase happiness. We have started this major project by assessing GiveWell’s top interventions and charities in terms of ‘subjective wellbeing’ (e.g. self-reported happiness and life satisfaction). So far, we have conducted cost-effective analyses (CEAs) of cash transfers and psychotherapy. Now, we are focusing our attention on understanding and replicating GiveWell’s CEA of deworming. Later this year, we will publish a report comparing deworming to cash transfers and psychotherapy in terms of its effects on subjective wellbeing. In this report, however, we are solely concerned with understanding the economic benefits of deworming.
Mass deworming is a large drug intervention targeting chronic parasitic infections such as schistosomiasis and soil-transmitted helminthiasis (GiveWell, 2018; WHO, 2006, 2011). These infections can cause a range of urinary, intestinal, nutritional, cognitive and developmental problems. The parasites are transmitted through soil and water because of a lack of proper sanitation. The drugs are cheap and unlikely to cause side effects so they are provided to individuals without testing for infection (which would otherwise be expensive; Hamory et al., 2021).
GiveWell has reviewed deworming multiple times (2016, 2017, 2018). Mass deworming is successful in reducing worm and infection levels, but GiveWell (2018) concluded that the main impact of deworming is the potential for preventing adverse effects on children’s development – and thereby long-term consequences – rather than the effects on preventing short-term health impacts or severe symptoms and death (both of which are rare). In their modelling, GiveWell represents this as long-term economic gains, i.e., the ‘good’ of deworming is an increase in income later in life.
According to GiveWell (2018), “Empirical evidence on this matter [long-term developmental impact from deworming] is very limited, resting primarily on one series of experiments stemming from Miguel and Kremer 2004”. That is a study of the Primary School Deworming Project (PSDP) using the Kenya Life Panel Survey (KLPS) (Miguel & Kremer, 2004) and its follow-ups (Baird et al., 2016; Hamory et al., 2021). There were four rounds of the KLPS data: KLPS 1, 2, 3, and 4. This research suggests that extra years of deworming treatment reduced worm infections and increased school attendance, hours worked, and income.
Except for some discounts and adjustments, GiveWell’s analysis of the long-term economic benefits of deworming is based on evidence from the KLPS. Economic outcomes were measured in KLPS 2, 3, and 4. GiveWell based their estimates on the early results provided to them before the publication of Hamory et al. (2021)2The numbers in the early data provided to GiveWell are not the exact same as the numbers in Hamory et al.’s (2021) publication, see their supplementary information (p. 5). However, this is only a very minor change and does not affect our points about the effects of deworming over time. In this document and the appendix, we maintain the use of the preliminary numbers because they are what GiveWell uses and we are trying to exactly replicate every part of GiveWell’s analysis except how it treats the effects through time.. This data shows a non-significant increase in earnings and consumption due to deworming. GiveWell focuses on the relative economic gains (the difference between the control and the treatment group), using the natural log of the gains. We show this data in Table 1.
Table 1: Economic effect of deworming across KLPS rounds3Note that there is no consumption data for KLPS2 because there was no detailed consumption survey provided to the respondents (Hamory et al., 2021). So when getting a pooled value for KLPS2, one can only take the value for earnings.
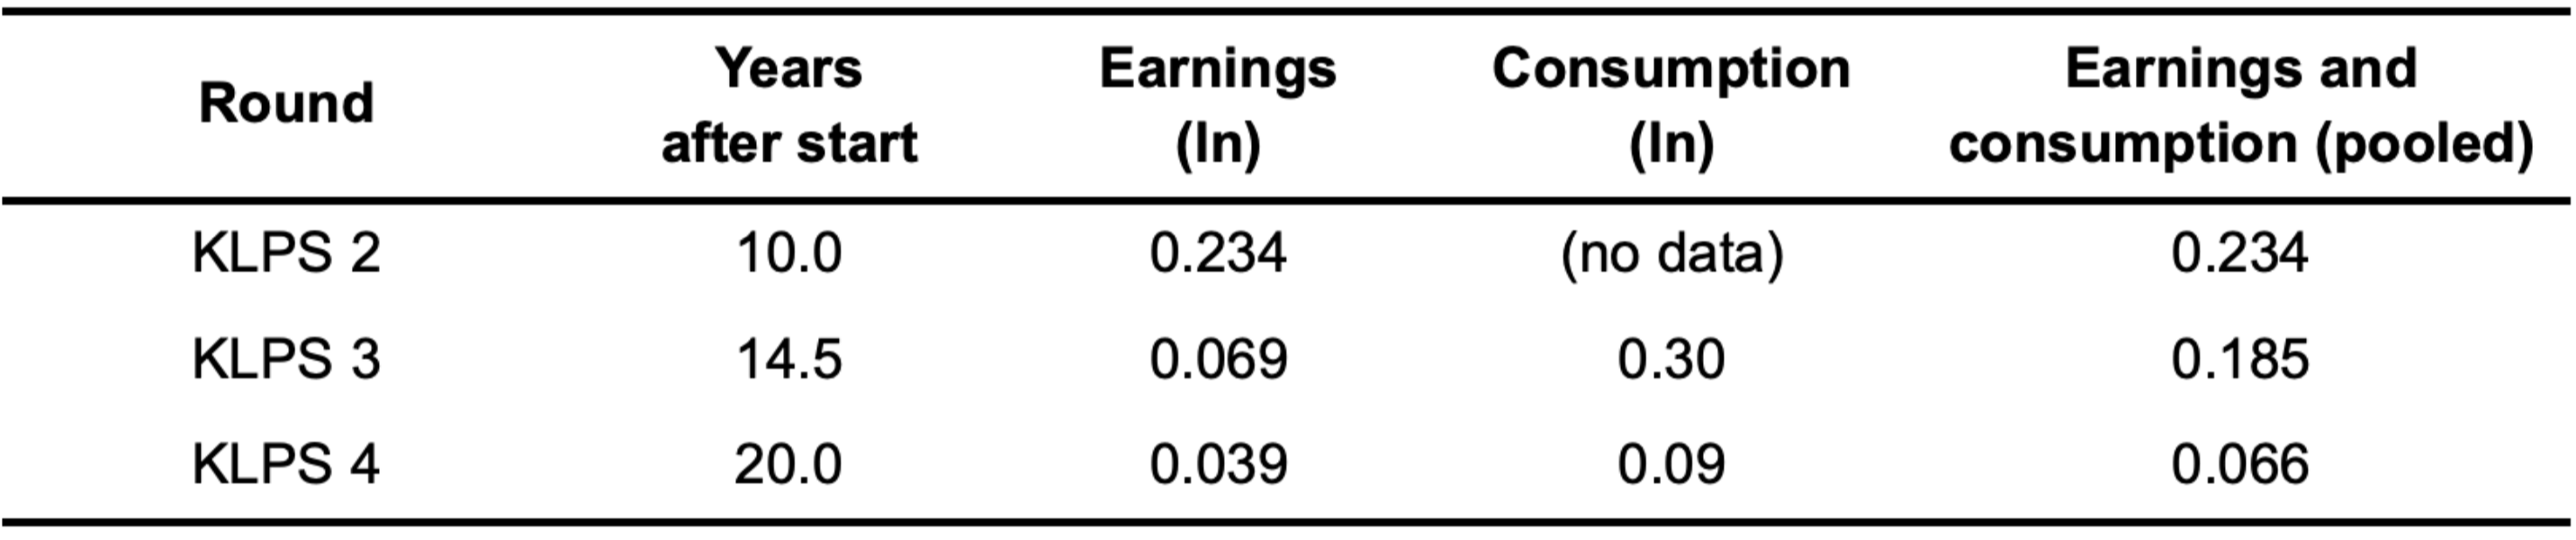
GiveWell averages different summary data points together in order to get one overall figure for the relative economic benefit of deworming. They then pool the earnings and consumption data together (which is why we show the pooled data in Table 1). Overall, they calculate that the relative economic benefit of deworming is 0.109 natural logs increase in income over the decade that spans the three follow-ups. This difference of logs approximates the percentage increase, so in other words, there is an 11.5% increase in economic outcomes on average across the ten years of follow-ups. You can see their calculation in this spreadsheet.
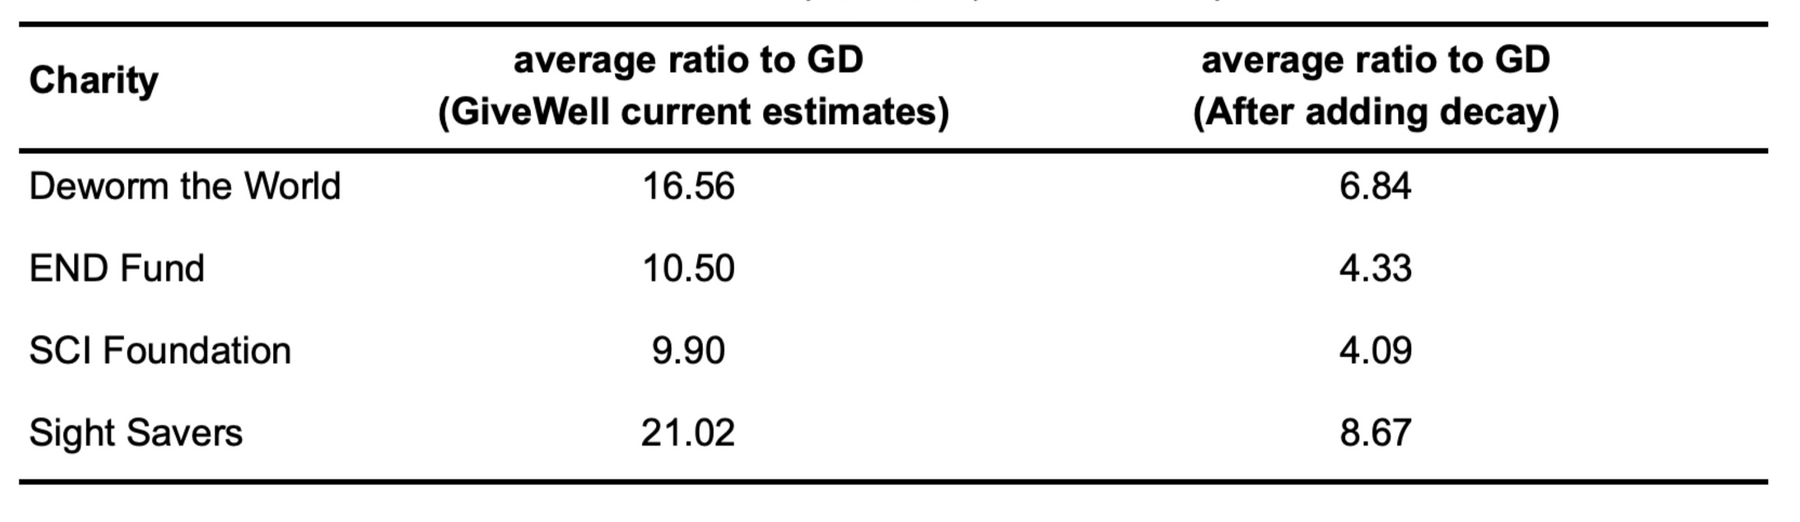
GiveWell models the relative economic gains of deworming as starting eight years after the intervention (recall, it’s schoolchildren who are dewormed – they won’t earn money until later) and having a constant effect for 40 years thereafter (i.e. the rest of the recipient’s working lives). However, the data above indicate that the effects decay. We calculate, using the pooled earnings and consumption figures, that the effect would exponentially decay with a rate of 88% (i.e., reduce by 12% each year). When we incorporate the decay over the 40 years suggested by GiveWell, the total effect reduces by 60%. See Figure 1, which illustrates the difference. Applying this would decrease many of GiveWell’s recommended deworming charities below their ‘bar’ of being 10 times more cost-effective than simply providing cash transfers to those in poverty, something the organisation GiveDirectly does. This is shown in Table 2 (this is Table 8 in the external appendix).
Figure 1: Comparing 12% decay model versus constant effects without a time discount

Note: These models exclude the 4% time discount GiveWell applies to all of their models. See Section 3.3 of the external appendix for models that include the time discount.
Table 2: Cost-effectiveness ratio to GiveDirectly (GD) adjusted for decay over time
2. Why the difference? A discussion with GiveWell
We could not find anything on the GiveWell website which discussed the difference between what the data indicated about the long-run effects and how GiveWell modelled them in their cost-effectiveness analysis. Because the difference is very substantial, we assumed that GiveWell would have mentioned it if they knew about it and, therefore, either they didn’t know about it, or we had misread the study.
When we contacted GiveWell to discuss this, they said they were aware that the study data indicated a decay over time and did not disagree with our calculations. As a result, we don’t explain the calculation in greater depth here (for details see our external appendix). However, they believe the decay we calculated in the data would not change their overall conclusion about the size of the effect. They provided two main reasons for this choice in the call and noted they had not made these public. We’ve tried to faithfully and charitably reconstruct GiveWell’s explanations below4We find it uncomfortable to state someone else’s views and then object to them. If we had noted the discrepancy in interpretation but not given GiveWell’s (private) reasons, we imagine we would be accused of being uncharitable. However, to state someone else’s view leaves us open to the charge we are misrepresenting them. If we have done so, we will happily correct it. It is for these reasons we strongly encourage GiveWell to make their views public.. We found the reasons unpersuasive, and we will explain why.
Update 15/08/2022: When we published this summary we were operating on the understanding of GiveWell’s views that we had formulated from their write-ups, research, and our discussions with members of GiveWell’s research team. We are grateful for their subsequent public statement which clarifies and updates their view.
2.1 GiveWell’s prior beliefs about the trajectory of the benefits over time
GiveWell said they had a strong prior belief that deworming has a constant effect over time. Their hypothesis is that deworming improves cognition and educational outcomes, and that enables the recipients to earn more for the rest of their lives. They also explained that they consider the evidence for the trajectory of the benefits over time to be weak and therefore stick to their prior belief.
Why is the study only weak evidence? GiveWell noted that the estimates for the economic benefits of deworming are very uncertain. The confidence intervals around the data points are large and get larger with time. Hence, the relationship over time is also uncertain and the difference over time is unlikely to be statistically significant. We note, however, that the treatment effect in general (the difference between the control and treatment groups) is not statistically significant either.
GiveWell thinks that the consumption data from KLPS3 is lower quality than the data from KLPS4. Plus, in KLPS2, some participants were still in school whilst others were working, making the economic benefits of deworming at that point in time uncertain. Hence, GiveWell suggested that if one focuses on the findings between KLPS3 and KLPS4 for earnings, there would be less decay. If we use only the figures from the earnings (not pooled with consumption) in KLPS3 and KLPS4, we do find a weaker decay than with the whole data but only a bit weaker (a decay of 90% instead of 88%, which reduces the total effect by 50% instead of 60%).
In light of this, GiveWell thinks it is more appropriate to rely on their priors rather than the evidence from the KLPS data5We speculate that GiveWell’s priors are based on studies like those they mention in this document that illustrate that interventions that seem to improve children’s developmental trajectories lead to higher incomes later in life.. In other words, GiveWell is saying, “we know the study suggests a decay but we think there are good reasons to discount it and believe something else”.
We find this response unconvincing. We do not understand the justification for having such strong beliefs about the long-run effect of deworming: it entirely discounts the KLPS data, which is the only data for long-run economic benefits. To be clear, it’s not that we have a strong view that the effects would decay over time. Rather, we don’t have a strong view either way and therefore are prepared to be led by the evidence. Our past research (on cash transfers and psychotherapy) has shown that effects decay over time, so that strikes us as the norm, rather than the exception. It seems plausible to us that the effects of deworming would reduce over time: children who are dewormed may do better in school than those who are not, but, as the data suggests, the other children could still ‘catch-up’ on that difference over the rest of their lives. Note, GiveWell specifies that the economic benefits are relative to a comparison. This means that if the comparison group is getting richer, the absolute benefits need to increase for the relative economic benefits to stay constant. We could be convinced that deworming has a constant lifetime benefit, but GiveWell has not argued for this publicly or provided sufficient evidence in support of that claim. We encourage them to do both.
2.2 GiveWell’s general beliefs about the effect of deworming
The other reason GiveWell gave is that they already apply a very large ‘replicability’ adjustment to the effect obtained from the KLPS data. They discount the effect of the treatment observed in the data by 87%. GiveWell’s general point is that even when you discount the effect suggested by the KLPS data, deworming still looks promising (see, for example, this post).
Our initial understanding was that this adjustment was based on uncertainty about specific aspects of the study (e.g., there are no replications of it, it is only one study, it does not have a ‘true’ control group, and the mechanisms are unclear) and that GiveWell tried to adjust for these factors. However, after our conversation, it seems that this replicability adjustment is more general and aims to adjust the effect from the data so that it reaches an effect size GiveWell considers ‘plausible’. Decisions about the size of the adjustment are based on a combination of subjective and empirical approaches (see here and here for details). Note that these are linked-to-documents, not front and centre in explaining the CEA.
Our understanding of GiveWell’s approach is that any uncertainty about analysis elements based on the KLPS data which would make for smaller effects – such as decay over time – is already included in this replicability adjustment. If they were to explicitly incorporate the decay in their CEA, they would modify the replicability adjustment so that the effect still reaches what GiveWell considers to be ‘plausible’.
With the 87% adjustment, GiveWell calculates a total relative economic benefit of 0.115 natural logs. Without the adjustment, the effect would be 0.115 / 0.13 = 0.885 natural logs, which GiveWell considers to be implausibly large, hence the replicability adjustment. Even if we reduced it by 60% (as the exponential decay suggests), 0.885*0.40 = 0.354 is still larger than the total effect GiveWell uses. Only when we combine the 87% replicability reduction (which, remember, we had no reason to think included the trajectory of the benefits over time) with the 60% of the decay that we get 0.047, which is smaller than 0.115 (and why the charities would no longer pass the 10x bar – as we explain in the appendix).
It seems GiveWell is saying something like: “to be conservative, we have already applied a very substantial non-specific reduction of the effects of this intervention in our model. We don’t need to adjust it further if we identify a specific reduction – we’ve already ‘budgeted’ for that in the non-specific reduction”.
We do not understand this reasoning as it stands. It’s possible that we’ve misunderstood it and so we encourage GiveWell to clarify and explain their thinking publicly.
Why do we find this reasoning suspect? The aim of cost-effectiveness analysis is, presumably, to accurately estimate cost-effectiveness; it’s not clear why you would apply an adjustment that is larger or smaller than what is justified by your available evidence. It is difficult to understand at present what the available evidence is that is being referred to.
The more puzzling concept is the idea that, if you realise you should change one bit of your analysis, you would be justified to arbitrarily alter another, unrelated and non-specified, part of it to ensure you retain a ‘plausible result’. Of course, if we have some idea of what the answer is, and our calculations fail a ‘sanity check’, we need to double-check our calculations. If you learn one of those calculations is wrong, then you should change that one. But you shouldn’t change something solely to pass the sanity check.
Finally, if you conduct an evidence-based analysis, but you look at the available data and end up saying “those figures can’t be right – let’s change them by a factor of eight”, it raises the question: what’s the point of doing or sharing the analysis at all? If your prior beliefs, rather than the data, are doing (nearly) all the work of your overall conclusions, then it seems appropriate to communicate that clearly and explain your reasoning for those beliefs.
3. Recommendations
Here, we make several recommendations for how GiveWell could improve their analysis and their communication of it. GiveWell publishes a large amount of important, decision-relevant work, so it is crucial that people are able to understand, critique, and develop it.
First, GiveWell should publicly explain and defend their assumptions about the effect of deworming over time. As we argued above, this assumption has not been made public, the reasons given for it (in conversation) are unconvincing, and it makes a substantial difference, reducing the effect by 60%.
Second, we think that GiveWell should explain their CEAs for various interventions in writing. GiveWell’s reports are primarily a discussion of the evidence. Their CEAs are communicated by their (famous) spreadsheets, but these are hard to follow unless you already know what’s going on. Spreadsheets are good for showing what you’ve done, but not why you’ve done it. For the latter, you need an accompanying explanation. We think our CEAs of cash transfers and psychotherapy do a good job of communicating how we reach our conclusions.
Third, we’d like GiveWell to discuss how sensitive their results are to changes in various parameters. For instance, it would be interesting to see how the cost-effectiveness of deworming would change with and without important parameters such as the replicability adjustment, decay of effects over time, other adjustments and discounts, etc. This could be fixed by running and communicating robustness checks (these are standard practice in academia, although we recognise that is not GiveWell’s audience). Again, we think we make a decent first attempt in our report on household spillovers (McGuire et al., 2022; Section 5), although more can probably be done.
Fourth, we hope to see greater clarity on which inputs are subjective and which are objective6Note, an input can be subjective without being related to morality – a guess of how many sweets are in the jar is subjective, even though it’s about a matter of fact.. We’d like to see the results from studies presented separately from the prior belief of the analysts. If there is a clear prior for an effect, it should be explicitly mentioned and incorporated, instead of referenced in a linked document. In the case of deworming, GiveWell could clearly state, based on their reading of the literature, what they believe is the ‘true effect’ of deworming and explain how much it is influenced by the KLPS data. This wasn’t obvious to us, and we assume it isn’t to other people either.
By separating facts from opinions, different stakeholders can understand how the results would differ depending on their own prior beliefs. Relatedly, a version of the analysis with the upper and lower bounds of their subjective inputs could also be done. This would allow donors and researchers to assess how much GiveWell’s beliefs impact the final conclusions and understand where to input their own beliefs, if they differ.
In broad terms, we think that GiveWell’s reports should align more closely with academic norms where authors are expected to fully explain their data, methods, and analysis, as well as the factors that their conclusions are sensitive to. The amount of further research that builds on GiveWell’s methods is less than it could be. We think that GiveWell’s methods are, in many places, an improvement over the status quo in economics and it is a loss that there is not more takeup of their approach. An incremental move to more academic norms may help with this.