
A Happy Possibility About Happiness (And Other) Scales
- A Happy Possibility About Happiness (And Other) Scales
- Abstract
- 1. Introduction
- 2. Units of measurement
- 3. What does the Cardinality Thesis consist in?
- 4. How should we interpret subjective data if one (or more) of these conditions does not hold?
- 5. Can the conditions be tested and, if so, how?
- 6. A Grice-Schelling hypothesis about subjective scale interpretation
- 7. Assessing the conditions
- 8. Does the existing evidence support the Cardinality Thesis? What further tests could be done? What would we do if it were false?
- 9. Conclusion
- Bibliography
Abstract
There are doubts about whether subjective scales—such as happiness surveys—are cardinally comparable; it remains unclear whether these doubts are justified. This paper attempts the first comprehensive investigation of the issue, focusing specifically on measures of subjective well-being. It clarifies which assumptions are needed for cardinal comparability—there are four—and states what follows, for data interpretation, if each assumption fails. It emphasises that, even though these assumptions concern subjective states—which, necessarily, are not objectively observable—we can nevertheless assess them. It proposes a ‘Grice-Schelling’ hypothesis of how people interpret subjective scales based on insights from the philosophy of language (Grice, 1989) and game theory (Schelling, 1960). The basic idea is that, when presented with a subjective scale, individuals, to make themselves understood, will interpret it how they expect others will; this so happens to result in individuals’ answers being cardinal comparable. The paper then surveys the extant empirical evidence to assess each of the four assumptions. Ultimately, it concludes subjective scales are cardinally comparable—or, at least, close enough to it is reasonable to treat them as such. It then makes some suggestions for further work and outlines how subjective data could, if necessary, be ‘corrected’ to make them cardinally comparable.
1. Introduction
When communicating, we sometimes use words—‘good’, ‘bad’, ‘abysmal’, ‘average’, etc.—to convey the intensity of how we think or feel. Sometimes, we use numbers: we find it intuitive to rate, on a (say) 0-10 scale, our happiness, job satisfaction, health, pain, romantic partners, the movies we watch, the products we buy, and so on. In each case, we assume the listener will understand that different words and numbers have different meanings.
Let us call these numerical ratings of our thoughts and feelings subjective scales. There are long-standing doubts about whether answers to subjective scales are cardinally comparable, that is, whether each one-point reported change, on a given scale, represents the same size change and the numbers mean the same things across different people and over time.1 An entirely separate question is whether, given we have had the same increase in happiness, our increases have the same moral value. This essay is solely concerned with descriptive questions about magnitudes of subjective states and not about the value of distributions of these states. To illustrate the doubt, if two people say they are 7/10 happy, how confident should we be that they are as happy as each other?2 A further issue, if the scales are cardinal, is whether they are of interval or ratio quality, terms we return to later. Unless otherwise noted, when I say ‘cardinally comparable’, the sense of ‘comparable’ I mean is across people and over time.
If subjective scales could only be interpreted as ordinal—that is, the numbers represent a ranking but contain no information on magnitudes—that would be a serious inconvenience. Ordinal data cannot express unit changes, which means we could not, for example, say how much different outcomes would increase total happiness. Ordinal data cannot be meaningfully averaged either, which would make it incoherent to claim as, for instance, the 2021 World Happiness Report does, that Finland is the happiest country in the world, with average life satisfaction of 7.889/10 (Helliwell et al., 2021).
Why might subjective scales not be cardinally comparable? One possible issue is that the subjective phenomena are not cardinally measurable in the first place: it is if, and only if, happiness, pain, etc. are intrinsically cardinal, that is, they have intensities that differ in magnitude, that we can meaningfully put them onto a cardinal scale. If, for instance, pain was not intrinsically cardinal, then it would be confused to say, “this is going to hurt you as much as it hurts me.”
The second concern is that, assuming subjective phenomena are cardinally measurable, whether answers to surveys questionnaire are, in fact, cardinally comparable. This is question about reporting behaviour—how people interpret subjective scales. When given a (say) 0-10 happiness scale, individuals must first consider how they feel on the inside. Then they must decide on their reporting function: how to translate their intensity of feeling (which is not logically bounded) into a numerical score on the bounded scale. To get cardinally comparable answers, individuals’ reporting function must be both (A) linear, which means each 1-point report changes represents an equal change in intensity—this makes each person’s scale cardinal at a time—and (B) comparable, that is, the points on the scale have the same meaning (across people and over time).3 This is explained and justified in section 3. Researchers often assume this is how people report their feelings (Blanchflower and Oswald, 2004). The natural worry is that individuals are not, in fact, willing and able to report in this way, which means we cannot take subjective scales at ‘face value’, i.e., assume they are cardinally comparable.
This paper investigates, and ultimately tentatively defends, what I will call the Cardinality Thesis (‘CT’) the claim that subjective scales are both (1) cardinally measurable and (2) because people report in the way just specified, cardinally comparable. I take (1) is, and should be, uncontroversial; hence the main concern of the piece is (2). In other words, the debate is less about whether we can have measuring sticks for our feelings at all, but rather, by analogy, whether our measuring sticks are bent and/or of different lengths. I focus specifically on measures of subjective well-being (SWB)—self-reports of happiness, life satisfaction, and meaning—although I expect what I say will apply to subjective scales in general; see OECD (2013) for an overview of SWB measures.4 To be clear, this paper is about the relationship between (A) reported subjective and (B) experienced subjective well-being, and not the relationship between (B) and (C) objective stimuli, such as changes in life circumstances. Of course, individuals feel differently in response to changes in objective circumstance (the have different ‘utility functions’) but this is irrelevant for the question at hand, which is whether there is a common way of reporting how they feel.
Curiously, beliefs about cardinal comparability for subjective scales divide on disciplinary lines. Speaking broadly, psychologists find it unproblematic, whereas economists consider it controversial (Ferrer‐i‐Carbonell and Frijters, 2004; Kristoffersen, 2010). It was, however, not always so controversial in economics. Victorian economists, such as Bentham and Edgeworth, were ultimately interested in utility, by which they meant happiness, the pleasantness/unpleasantness of conscious experiences (Bentham, 1789; Edgeworth, 1881). Happiness was taken to be cardinal in nature and, in principle, measurable as such. It was in the early-mid 20th century that economists such as Robbins persuaded their colleagues that cardinal measures of people’s feelings were not only impossible in principle—how could we know what happens inside others’ heads?—but also unnecessary, because the discipline should instead focus on how people behaved under conditions of scarcity (Robbins, 1932; Hausman, 1995; Layard, 2003; Kristoffersen; 2010). Resultantly, ‘utility’ came to be associated with preferences rather than happiness and economists effectively gave up on measuring or comparing people’s feelings.
Interest in subjective well-being started to return to economics in the 1970s; it is now a burgeoning field (for a review, see Diener, Lucas and Oishi, 2018). Nevertheless, doubts about whether subjective data can really be believed continue to lurk in the background and prevent their wider use. A prominent, recent example of such scepticism is Bond and Lang (2019) who argue, in a descriptively named paper, The Sad Truth About Happiness Scales, that various well-known results in the happiness literature—such as that marriage increases happiness—rely on CT and can be reversed if one makes different assumptions about how individuals report their happiness. I briefly discuss this paper later and argue it relies on assumptions there are good reasons to reject.
Although the nature of subjective scales is both fundamental and disagreed upon, there has been surprisingly little explicit discussion of CT in the literature. According to Kristoffersen (2010), in what seems to be the most substantial extant review:
the cardinality issue appears to be an example of the proverbial elephant in the room: everybody knows that the problem exists but nobody wants to talk about it more than what is absolutely necessary.
There are notable exceptions to this rule, where researchers have engaged with one or more aspect of the problem. For instance, Ng (1996, 1997, 2008) argues happiness is intrinsically cardinal and measurable in principle, although individuals’ reports may not be cardinally comparable—at least not without statistical adjustment. Ferrer‐i‐Carbonell and Frijters (2004) show that, whether one treats SWB data as ordinal or cardinal does not substantial change the results, although they do not explain why this should be the case. Kristoffersen (2010) herself provides an intellectual history of the debate and an overview of several issues.
What we do not yet have, however, is a comprehensive theoretical and empirical review of the problem; that is, an analysis which: (1) clearly specifies what all the ‘moving parts’ of the problem are—the issues need to be addressed; (2) addresses those issues by drawing on and, where necessary, developing the existing literature; (3) reaches an overall conclusion about whether subjective data are cardinality comparable—and, if they aren’t, in which way they are not, and what can be done about it.
This paper makes two types of contribution. One is to provide the first comprehensive theoretical and empirical review of the cardinality comparability of subjective scales. Prior discussions of cardinal comparability, such as, Kristoffersen (2010) and Hirschauer, Lehberger and Musshoff (2015), have been primarily hypothetical, rather than evidence-based, as well as left some theoretical gaps—this is described further below. This paper ultimately concludes we can, in practice, assume such scales are cardinally comparable, then makes some suggestions for how to proceed from here.
The other type is to advance, whilst undertaking this review, our understanding of the various individual parts of the problem. The two most significant additions are the proposal of a ‘Grice-Schelling’ hypothesis about how individuals might interpret subjective scales and the provision of the first detailed empirical review of how they do interpret them. Before elaborating on the specific contributions, we should first set out the issues that need to be addressed and the state of the current literature. Here are the theoretical and empirical questions that pertain to evaluating CT—I am not sure these have been stated before:
- What are the necessary and sufficient conditions for the Cardinality Thesis? In other words, what are these conditions for each of (1) cardinal measurability and (2) cardinal comparability?
- What would follow, in terms of data interpretation, for each condition if it does not hold?
- Can we determine if these conditions are true and, if so, how?
- What is our theoretical explanation of how individuals interpret subjective scales? What would this theory imply about cardinal comparability for answers to surveys?
- What does the evidence indicate about each condition? Taking these together, how reasonable is it to assume CT?
- If subjective scales are not cardinally comparable, can we ‘correct’ them so that they are and, if so, how?
While Kristoffersen (2010) touches on each of 1-6, it leaves some large gaps. As I elaborate on later, there are four conditions which are individually necessary and jointly sufficient for the Cardinality Thesis—the first relates to cardinal measurability, the latter three to cardinal comparability:
C1 Phenomenal Cardinality: the underlying subjective state is perceived in units of intensity.
C2 Linearity: there is a linear relationship between the true and the reported subjective state.
C3 Intertemporal Comparability: for each individual, the scale has the same meaning over time
C4 Interpersonal Comparability: for different individuals, the scale has the same meaning at a time
Kristoffersen (2010) only discusses the first two.5 Kristoffersen (2011, 99) claims the latter two conditions have been addressed elsewhere, citing Larsen and Fredrickson (1999) and Diener and Suh (2000). However, neither of those references, which do discuss measurement issues, seem to specifically tackle the issue of uniform scale interpretation. For instance, the evidence noted by Larsen and Fredrickson (1999), that observer-ratings correlate with self-ratings, indicates ordinal comparability but does not show scale use is (close to) interpersonally identical. Further, although (2) is empirically testable, Kristoffersen (2010) does not supply any evidence for it, although there is an informative hypothetical discussion.6 Kristoffersen (2017) follows up and offers evidence regarding linearity. I explain in 5.2 why this evidence is, however, unconvincing.
Hirschauer, Lehberger and Musshoff (2015) do propose what are, basically, the right conditions for cardinal comparability—I elaborate on this in 5.1. Similarly, however, these authors speculate on whether the conditions hold but provide no evidence.
The empirical question of how individuals do, in fact, interpret subjective scales has not yet been resolved elsewhere in the literature either. Stone and Krueger (2018, 189), reviewing the state of play, write:
one of the most important issues inadequately addressed by current [SWB] research is that of systematic differences in question interpretation and response styles between population groups. Is there conclusive evidence that this is a problem? And, if so, are there ways to adjust for it? Information is needed about which types of group comparisons are affected, about the magnitude of the problem, and about the psychological mechanisms underlying these systematic differences.
The challenge with making progress on this issue is that what we need—but currently lack—is a hypothesis about how individuals would try to interpret subjective scales. Quoting Stone and Krueger (2018, 175) again:
In order to have more concrete ideas about the extent to which this may be a problem, we should have a better idea of why such differences might exist in the first place, and have some theoretical justification for a concern with systematic differences in how subjective well-being questions are interpreted and answered
Such a theory is important because subjective states, necessarily, cannot be measured objectively. It is therefore difficult, without a theory, to know what to infer from the evidence or which evidence to look for.
To reach an adequate assessment of whether subjective scales are cardinally comparable, we must start right at the beginning and fill in the key theoretical details. Specifically, we should both articulate how people need to interpret subjective scales for CT to be true and offer a theory of how they do interpret subjective scales. Once these theoretical ducks are in a row, we can then go on to assess the evidence and draw a conclusion.
That is just what this paper sets out to do: it aims to provide the first complete picture of CT by addressing, in turn, each of the six key questions identified above. Here, in brief, is what the paper claims and contributes in each case.
First, it clarifies what the necessary and sufficient conditions for the cardinality thesis are. This builds on and makes more precise the proposals in Kristoffersen (2010) and Hirschauer, Lehberger and Musshoff (2015).
Second, it specifies what follows, in terms of data interpretation, if each condition fails; this develops ideas in Ng (2008) and Kristoffersen (2010). Some of the conditions can fail by degree, hence subjective scales might not be exactly cardinal, but nevertheless close enough to it as makes no practical difference.
Third, it restates the claim that hypotheses about subjective states can be empirically tested; this has been made by e.g. Alexandrova and Haybron (2016).
Fourth, it proposes a ‘Grice-Schelling’ hypothesis of scale interpretation, drawing on insights from philosophy of language (Grice, 1989) and game theory (Schelling, 1960). The basic idea is that individuals, when given a vaguely-specified survey question, will try to answer it in the same way they expect others will in order to ensure their answer is correctly understood; in game theoretic terms, people are searching for ‘focal points’ around which to coordinate in the absence of communication. I suppose the two relevant focal points are a linear reporting function and using the scale endpoints as the realistic limits, i.e., “10/10 happy” refers to the happiest anyone can actually be. As a result of these, the answers people give happen to be cardinally comparable. This hypothesis provides an explanation for already the observed patterns—e.g. the linear reporting function indicated by van Praag (1991, 1993) and Oswald (2008). The hypothesis is part-revived—Grice’s (1989) cooperative principle has been mentioned by Schwarz (1995), but seems to have since been forgotten—and partially novel—Schelling’s (1960) concept of ‘focal points’ has not yet been applied to this problem.
Fifth, it surveys the extant empirical evidence regarding each condition. Various papers have set out to investigate one or more of the conditions; other work without this intention is nevertheless relevant. This paper synthesises these in what seems to be the first review of the evidence. It concludes that the evidence points to CT being true—or, at least, that CT is a sensible working assumption because deviations from cardinal comparability are likely to be too small, in reality, to be practically significant. This conclusion should be considered tentative—the evidence base is small and new research may overturn this.7 The conclusion is made with the now standard 11-point, 0-10 scales in mind. The cardinality thesis seems less plausible when we have fewer categories—say 3—as these are necessarily so coarse. To push the point, I am not sure what we should believe about the cardinal comparability of a 2-category scale.
Sixth, it argues that, following Ng (2008) and Kristofferson (2010), if subjective data are not currently cardinally comparable, we can ‘correct’ them. Some directions for further research are proposed.
The conclusion is therefore optimistic: it seems we can assume CT for now, and, if we later find a problem, we can correct for it.
A more general aim of the paper is to improve our conversations about the use of subjective data. Many people seem to object to the use of subjective data based on serious, but non-specific, worries about cardinal comparability—something just seems ‘weird’ about quantifying and comparing feelings. By identifying all the places where cardinal comparability might fail, and indicating it doesn’t, it should help sceptics and enthusiasts recognise exactly where they differ, thus allowing more productive disagreements.
The structure of what follows is straightforward: after a primer on units of measurement, each of the six sub-questions noted above are discussed in turn; a few remarks on whether subjective scales are of interval or ratio quality are made; the paper then concludes.
2. Units of measurement
Units of measurement are typically grouped according to their quantitative properties. The standard four-fold division is as follows (Stevens, 1946).
Nominal scales are used for labelling variables without quantitative information, for instance, gender, or hair colour.
Ordinal scales contain variables which have a relative magnitude, such as the order that runners finish in a race—1st, 2nd, 3rd, etc.—but lack information about the relative difference between those magnitudes.
Interval scales contain variables which can not only be ordered but where the difference between measurements on the scale are equal-interval—this is the condition for cardinality. Celsius temperature is the classic example—the difference between each one degree of temperature is the same in terms of the change in thermal motion. What interval scales lack is a non-arbitrary zero-point on the scale—a location where there is no underlying quantity of what the scale measures: there is still thermal motion at zero degrees Celsius.
Ratio scales have the same properties of interval scales with the addition of having a non-arbitrary zero point. Examples of this include mass, time, distance, and temperature when measured in Kelvins. Ratios are meaningful, e.g. 10 minutes is twice as long as 5 minutes.
Here, we are primarily concerned with cardinality, which is sufficient for an interval scale but not for a ratio scale.
What might it mean to say two scales measuring the same cardinal phenomenon, but which may use different numbers, are ‘cardinally comparable’?
There seems to be some as-yet-unrecognised ambiguity here. Let’s say scales have minimal cardinal comparability where a one-point change, on a given pair of scales, represents the same size change in the underlying property. In this sense, Celsius and Kelvin are minimally cardinally comparable—to convert from one to the other you add or subtract a constant—but neither are minimally cardinally comparable to Fahrenheit, as multiplication is required for that conversion. If, as is common with subjective scales, there is a fixed number of units on the scale, e.g. an 11-unit 0-10 scale, and two scales cover the same range of intensities their units will be minimally cardinally comparable.
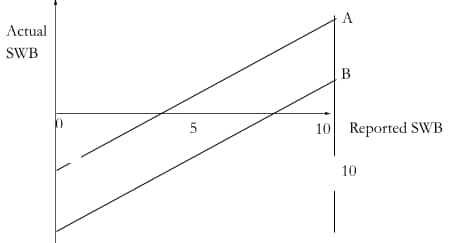
However, this still allows two scales to cover different levels. An example of this type is displayed in Figure 1: A and B, which might represent (say) two countries, have SWB scales with the same range but span different levels.
Figure 1: Minimal cardinally comparable scales with different levels
In contrast, let’s say a pair of scales have maximal cardinal comparability, if, in addition to having minimal cardinality, each number refers to the same level of intensity, i.e., 7/10 represents the same intensity of feeling on A’s and B’s scales. Note that maximal cardinal comparability does not require a ratio scale: two accurate Celsius thermometers would have maximal cardinal comparability whilst zero degrees Celsius remains an arbitrary zero point. While only minimal cardinality is needed for unit changes, maximal cardinality is needed for averages, e.g. to claim the English are happier than the Americans.
It is unclear which sense of cardinality comparability is ordinarily meant in the literature. For clarity, when I refer to cardinality comparability without qualification, I mean the maximal kind.
A further question, assuming two scales as maximally cardinally comparable, is whether they are of ratio quality in virtue of having a determinable non-arbitrary zero point. For some purposes, a ratio scale is needed, for instance, to compare the impact of extending lives to improving quality of lives in terms of SWB. It seems obvious that happiness is of ratio quality, because there is a natural zero point for it, namely when you are overall neither happy nor unhappy (Ng 1997). Hence happiness is, in principle, measurable on a ratio scale. There are, however, open questions about where, in practice, that zero point is on various SWB scales. This is a distinct question from those relating to cardinality and outside of the scope of this paper. I do, however, sketch some of the issues in a footnote for the interested reader. 8As indicated, one case where we need a ratio scale is to compare, in terms of SWB, the value of extending to improving lives. For improving lives, we simply take the change in SWB levels multiplied by duration. For extending lives, the natural way to assess the value of this is to determine the difference between average SWB and the SWB level equivalent to non-existence—the ‘neutral point’—multiplied by the additional expected years of life. Presumably, the neutral point on the SWB scale should coincidence the zero point of the scale: if it’s good for you to live longer because and to the extent you have positive SWB, then, if you have zero overall SWB, then it’s not good or bad for you live longer. Hence, we need to know the location of the zero point for the comparison. However, and this seems not to have been noticed, SWB researchers do not all put the zero and neutral point in the same place. Diener et al (2018), take the mid-point of SWB scales, e.g. 5/10, to be the zero point. That implies saying a person with 7/10 SWB is worth 2 ‘units’ of SWB a year. However, other SWB researchers use different values of the neutral point. Layard et al. (2021), in a policy analysis for COVID lockdowns, explicitly take 0 as the neutral point, although they provide no argument for this. Frijters and Krekel (2021) in a well-being policy handbook, advocate using 2/10 as the point from which to count the value of saving lives. They do provide a justification, which is that an a small (unpublished) UK survey, respondents would choose life over death at around 2/10 life satisfaction. Obviously, this is an unsatisfactory state of affairs. A topic for further work is to propose and evaluate different theoretical justifications for where to set the zero and neutral points, including whether they should coincide at all. Another case where we need a ratio scale is if we want to apply a non-utilitarian aggregation function when using subjective measures to determine the value of an outcome. Suppose we conceived of value in terms of well-being. For a utilitarian, the value of an outcome is the unweighted sum of each individual’s well-being. In contrast, prioritarians give more weight to the worse off—it is more important to go from a 2 to 3 than a 7 to 8, even though these are equal changes in well=being. To know how much extra weight to give, you need to know how far someone is from a zero point of well-being, hence the need for a ratio scale. See Holtug (2001) for an good, brief discussion of theories of value aggregation.
3. What does the Cardinality Thesis consist in?
If I claim that, when two people say they are 6/10 happy, they are each as happy as each other, which underlying assumptions are necessary, and which are sufficient, for my claim to be true? In discussions of CT, it is often not obvious exactly what adherents are asserting or sceptics denying. In this section, I set out and explain the individually necessary and jointly sufficient conditions for CT—some of this has already been noted and now requires elaboration. I do not discuss whether these conditions hold in reality—that is the subject of section 7.
CT makes two claims about subjective scales: (1) they are cardinally measurable and (2) answers to them are, in fact, cardinally comparable. These two claims can be decomposed into a four conditions:
C1 Phenomenal Cardinality: the underlying subjective state is perceived in units of intensity.
C2 Linearity: there is a linear relationship between the true and the reported subjective state.
C3 Intertemporal Comparability: for each individual, the scale has the same meaning over time
C4 Interpersonal Comparability: for different individuals, the scale has the same meaning at a time
C1 is the only condition for cardinal measurability: for the scales to be cardinal, the phenomenon itself must be cardinal in nature.
However, even if there is phenomenal cardinality, our measures might not be cardinally comparable due to how individuals report their experiences. This point is made by a number of researchers, e.g. Ng (1996), Kristoffersen (2010), and Hirschauer, Lehberger and Musshoff (2015). For cardinal comparability, we need C2-4, which relate to scale interpretation.
C2, linearity, means that a 1-point change on the scale represent the same difference in underlying feeling, e.g. going from a 5/10 to 6/10 happy is the same size change in happiness as going from a 7/10 to an 8/10. If individuals use a linear reporting function, then each person’s scale will, at given time, be cardinal.
In most cases, individuals are only given a limited number of options, which means they will pick the nearest option, and reporting follows a step-wise function illustrated in Figure 2 below. If we collect many reports, however, the relationship between true and reported states is effectively linear.
Figure 2: Linear stepwise relationship

If reporting takes anything other than a linear relationship, measures will not be cardinal (noted by e.g. Ng (1996); Kristoffersen (2010)). The two obvious alternatives to linearity are logarithmic and arc-tangential relationships, illustrated in Figure 3 below.
Figure 3: Logarithmic (left) and arc-tangential (right) relationships

The idea of a logarithmic relationship seems to come from a prima facie similarity to the ‘Weber-Fechner’ law in psychophysics, that is, the perceived intensity of a stimulus is proportional to the logarithm of its objectively measured intensity; thus physical forces, e.g. sound pressure, need to roughly triple for subjects to experience a one-unit change in subjective intensity, e.g. perceived loudness (Portugal and Svaiter, 2011).9 The details of the law are unimportant for our purposes.
The arc-tangential relationship is proposed by Ng (2008); on it, the distance in actual SWB increases at the extremes of the scale. Thus, the actual difference between a self-reported 9 and 10 (and equally, between 1 and 2) is greater than the difference between a 3 and 4, a 5 and 6, etc. Ng’s rationale is that, as there is no logical limit to happiness, the use of a linear representation which covered the full logical range would compress all changes in happiness from ordinary life event into a tiny range around the middle of the scale: e.g. becoming unemployed might take someone from 5/10 to 4.998/10. Ng supposes the advantage of the arc-tangent is that it makes the scale’s middle comprehensive while still allowing very high happiness scores to be represented at the top of the range.
A linear reporting function is necessary, but not sufficient, for interpersonal, intertemporal cardinal comparability: even if individuals use a linear reporting function (and so each individual’s scale, at a time, is cardinal) their scales could cover different ranges of intensities, resulting in a lack of cardinal comparability. For subjective scales to be cardinal comparable over time (and across people) requires that the numbers mean the same thing over time (and across people), in the sense each point of the scale specifies an intensity of sensation. There are two conditions, C3 and C4, which refer to different types of comparisons.
There are two further comments to make here.
First, the condition that the scales mean ‘the same thing’ is, in an important sense, underspecified: it leaves open exactly which range of intensities the scales must all cover. To bring this out, one option is that individuals could use 0/10 and 10/10 on a happiness scale to represent the real limits to happiness, that is, the unhappiest and happiest, respectively it is possible to be in the actual world, that is, this one.10 The actual limits can vary by time and place—e.g. imagine a future where we had new pleasure-enhancing technology or groups with very different genetics—so we can add, more specifically, we can add that these are the actual limits for those being asked the question and at the present time. Of course, the actual limits could differ in different times and places limits would be different in e.g. a. Admittedly, if the real limits barely vary between different groups and times, the specific sense of actual use will hardly matter. An This is, presumably, what Hirschauer, Lehberger and Musshoff (2015) mean when they say 0 is “100% unhappiness” and 10 “100% happiness”. However, we could also use the endpoints to refer to (say) twice the real limits; if all did this, the reports would still be cardinally comparable. One non-arbitrary pair of endpoints are the logical limits—this is, as noted, what Ng (2008) supposes we do use for scale endpoints. The issue with this is that there is no logical maximum to happiness, so all actual experiences would be infinitesimally small on such a scale. Another non-arbitrary option would be to use the nomological limits for subjective states—the maximum and minimum within the laws of nature as they are in this universe, for any entity; perhaps this is what Ng had in mind. Of course, the happiest a human can be is a tiny fraction of the nomological maximum to happiness.
I flag these options to make the point that there are different ways to interpret the scale endpoints and, for cardinal comparability, individuals must collectively converge on one of them. I will later argue people probably do use the real limits; that is why I said earlier Hirschauer, Lehberger and Musshoff (2015) were basically right: while individuals don’t have to use the real limits, that is one way—the most obvious way—to make the answers cardinally comparable.
Second, so long as individuals do use at least the actual limits, we can clear up the confusion caused by the realisation that happiness is, in principle, unbounded, i.e. has no logical limit, but that survey responses are bounded, i.e. you cannot report being happier that top of the scale. Note that, if the scales are constructed to span all the actual possibilities, there is no sense in which they are practically bounded. By analogy, if we wanted to measure people’s heights, we would not claim our tape measure was practically inadequate because it was only 12 foot long.
Hence, C1-4 are individually necessary and jointly sufficient for the Cardinality Thesis and C3 and C4 are, as written, underspecified.
4. How should we interpret subjective data if one (or more) of these conditions does not hold?
Now we have the four conditions stated, we can ask what happens, in each case, if they do not hold.
C1, phenomenal cardinality, either does or doesn’t hold. If it doesn’t hold, the construct is not cardinally measurable; by analogy, C1 is about whether we can have a measuring stick at all.
However, the three conditions relating to cardinal comparability—those about scale interpretation—can fail to a greater or lesser extent. Continuing the analogy, C2 concerns whether the measuring sticks are bent, C3 is if the length of each stick changes over time, and C4 is whether different people have the same length sticks as each other.
Hence, assuming C1, if one or more of conditions two to four fail, that means the self-reported data are not exactly cardinal in aggregate and, therefore the subsequent concern will be how far the data are from being cardinal (again, in aggregate). Of course, it matters if our measuring sticks are slightly bent or very crooked. The cardinality thesis could fail to be exactly true, whilst being close enough as to make no practical difference—although a metal tape measure bends slightly, we rarely think this is substantial enough to make a difference.
Therefore, we should now specify that, assuming C1 holds, C2-4 are the conditions for subjective data to be cardinally comparable, in aggregate, when analysing individuals’ ‘raw’, i.e., unadjusted scores.
If the raw data are not, due to issues with C2-4, exactly cardinal, but we know how our ‘measuring sticks’ have gone wrong, we can apply the appropriate mathematical function to ‘correct’ this and get cardinal transformed data. For instance, if we determine that the French sense of maximum happiness is 10% higher than the German one, we can appropriately shrink the latter to make their answers the same.
For C2-4 to hold in aggregate, it is not necessary that conditions 2-4 obtain for every individual. Individuals can deviate from the conditions, but so long as these deviations are random—e.g. some people use slightly longer scales than others, some slightly shorter, some people’s ‘kink’ one way, some the other—then any differences will statistically ‘wash out’ as noise and can be ignored. Some researchers seems to think, on the basis of this ‘washing out’, we should assume subjective scales are cardinally comparable; it is the only reply offered by Dolan and White (2007) and Bronsteen, Buccafusco and Masur (2012) in response to worries about scale interpretation. This is too fast: while random deviations from the conditions will ‘wash out’, non-random one won’t; if the French really do use a different scale on average to the Germans, those data will be systematically biased and not exactly cardinally comparable on average.
Of course, it seems reasonable to worry that there could be systematic differences between groups and/or at different times. Hence that is something we should investigate, if we can.
5. Can the conditions be tested and, if so, how?
A natural worry for understanding anything subjective is that it is not, by its very nature, objectively observable. This means we cannot have an objective test for phenomenal cardinality, nor can we be certain whether differences in reported happiness are due to (a) differences in experienced happiness, (b) differences in reporting behaviour or (c) or some combination of the two. Should we assume then, that no evidence or reasoning would have any bearing on this topic? Is this, in the end, a matter of faith?
This would also be much too fast. What we should do here is what we would do for any other scientific question, namely use inference to the best explanation, the cornerstone of the scientific method (Harman, 1965;Boyd, 1980; Williamson, 2017). Although this may seem obvious, I have been surprised to find many sceptics of CT seem to think that, because we cannot objectively measure subjective states, all hypotheses about subjective states are therefore equiprobable.
To test our hypotheses, we can draw on our background beliefs, including experience of our own mental states, about how some objective measure will behave in relation to the subjective data. If the objective data behaves as expected, that increases our credence that the subjective reports really are as they appear, and vice versa.11 This employs a Bayesian approach to epistemology. See Talbott (2016) and references therein. While a formal Bayesian analysis of this topic (where we specify our prior probabilities in certain beliefs and then say how evidence updates our posterior probabilities) is possible, it would add little. For example, Kristoffersen (2010) notes that we might expect those who report higher on happiness scales to spend a greater per cent of their time smiling. Hence, if that is what we observed this would be evidence of, at least, scale ordinality.
Importantly, what we can infer from some objective test depends on the confidence and specificity of our background theory about the relationship between the objective test and the subjective experience. I later argue that there are some precise and compelling theoretical assumptions we can use that allow us to test the various conditions for CT.12 One option I do not investigate is to rely on the assumption from Edgeworth (1881) that all ‘just perceivable increments’ (‘JPIs’) of sensation are the same for everyone at all times. One could perhaps try to experimentally count the number of these required to cause a 1-unit change on various people’s 0-10 scales. See Ng (1996) for a (complicated) study using JPIs. Before that, we should say more about the theory of how we expect individuals to interpret subjective scales.
6. A Grice-Schelling hypothesis about subjective scale interpretation
For the Cardinality Thesis, the central issue is how individuals choose to report their inner states when given a numerical scale. We have seen that cardinal comparability will occur if individuals use a linear reporting function and the same endpoints. We now need a hypothesis—a story—about how people will try to interpret subjective scales. In this section, I offer a ‘Grice-Schelling’ hypothesis of scale interpretation and argue that it generates the specific prediction that individuals will, it so happens, interpret scales in a way that leads to Cardinality Thesis being true. I set out the theory in this section, then consider the evidence for the various pieces of it in the next section. The hypothesis combines two ideas and draws it name for the key contributor to each. The first idea comes from the philosophy of language (Grice 1989) and, while it has been mentioned in reference to subjective scales before (by Schwarz (1995)) seems to have since been forgotten. The second relies on game theory (Schelling, 1960) and, as far as I know, has not been applied to this topic before.
Let’s quickly (re)state the problem. Suppose, I ask you, “How happy are you?” and give you a 0 – 10 scale. To answer my question, you need to consciously or unconsciously fill in two details about the meaning of the numbers of the scale which are not specified. The first is your choice of reporting function—the relationship between your experienced and reported happiness. The second is what the endpoints of the scale refer to—these might be given a verbal label, such as ‘very happy’ or ‘completely happy’ but those are still vague.13 In addition, one must decide on at least two non-numerical issues: what does ‘happy’ mean? What time period is being asked about (right now? In general? Recently? Etc.)? While such questions are relevant for comparing answers, they are beyond the scope of this essay. For some discussion, see Benjamin et al. (2020). Here, I concentrate only on the numerical issues of scale interpretation, i.e. I assume that individuals are answering the same qualitative question and then ask, further, whether we can conclude their answers are cardinally comparable. The same issues apply to other subjective scales, but I continue to refer to happiness for simplicity.
Of course, we could label subjective scales so that individuals do not have to infer how they should be used. We could state that individuals should use a linear reporting function and that the endpoints were the actual limits. However, this is not usually done—see OECD (2013, Annex A) for a list of survey questions. I am not aware of it ever being done, and I suggest later how further research could make use of such specificity.
Given this, how should we expect people to interpret subjective scales? Paul Grice (1989), a philosopher of language, observed that conversations are often cooperative endeavours, where speakers and listeners rely on each other to think and act in certain ways in order to be understood. Grice proposed the cooperative principle: “Make your conversational contribution such as is required, at the stage at which it occurs, by the accepted purpose or direction of the talk exchange in which you are engaged”. This principle has several maxims, which are, roughly: to be truthful, to give no more and no less information than required, to be relevant, and to be clear.
Schwarz (1995) argues that Grice’s cooperative principle equally applies to survey questions, where individuals will treat the survey question as if they were asked in a conversation and use all the information provided to give an appropriate answer.
Hence, we can expect individuals to be cooperative when given subjective scales. This still leaves open the question—one Schwarz (1995) does not answer—of what, specifically, the cooperative response is.
For this further piece of theory, we turn to economic game theory. Here is a description of the ‘game’ being played: cooperative individuals are trying to accurately communicate their inner states to the researcher. There is, however, vagueness about the meaning of the subjective scales and individuals cannot communicate with each other to agree on a precise meaning. Individual will infer that their answers will nevertheless be interpreted in relation to those of others. Hence, to make their answers informative, individuals will try to anticipate how other people will interpret the scale, then give their answer on those terms. If I am confident that, when I say I am ‘8/10’, I mean something others from what others mean, I am being uncooperative and can expect to be misunderstood; this scenario is analogous to one where I call something ‘black’ that I know others would call ‘white’.
In game theoretic terms, individuals are seeking a Schelling point, or a focal point, a cooperative solution picked in the absence of communication (Schelling, 1960). The most famous illustration of the Schelling point is the New York question: if you are to meet a stranger in New York City, but you cannot communicate with the person, when and where will you choose to meet? Thomas Schelling, the Noble prize-winning economist after whom the term is named, asked a group of students this question and found that the most common answer was noon (at the information booth) at Grand Central Station. One could meet at any time and place, but certain answers are, for whatever reason, more salient and more likely to lead to successful coordination.
What are the specific Schelling points for subjective scales? I hypothesise that, when respondents are asked to rate the value of a subjective state and are given a limited number of options, e.g. a 0 – 10 scale, but no further information, they will interpret the top and bottom of scales as, respectively, the lowest and highest values the state takes in practice, and then interpret the scale as linear, so that each point on the scale represents the same change in magnitude.14 An anonymous referee proposes that, if that were to do this, they would estimate 0/10 at -1,000,000 ‘units’ and 10/10 at +100,000,000 units, whereas their usual variation would be between -1,000 and +10,000 units. Using a linear variation, that would indicate their usual happiness levels as being between roughly 4.99 and 5.1. As this is not what we observe, they suppose individuals must use an arc-tangent function. I suspect the referee and I disagree on the ratio difference between our usual ranges and the realistic limits of experience. I suppose that getting married or scoring a world cup goal are representative cases of maximum realistic happiness. I feel modestly above neutral now—I might say I am 55/100 on a 0-100 scale with 50 represent hedonic neutral—and I expect such events might feel 10 time better. Certainly, I do not expect they would be 10,000 times better. Assuming I am representative, a linear reporting would not compress individuals scores in between 4.9 and 5.1. Later on, I cite empirical evidence in favour of a linear reporting function.
Why expect this?
Turning to the reporting function, linearity is the natural choice as it makes the scale cardinal. As Ferrer‐i‐Carbonell and Frijters (2004) note, cardinal scales are the type people are familiar with, e.g. what we use for measuring length, weight, height, income, hence the default option we expect others to use. The issue with, say, logarithmic or act-tangential functions is that there is an infinity of specific non-linear functions to choose from, and one could not reasonably expect a stranger to guess which one you will use. For instance, for a logarithmic reporting function, does each one-point increase represent a doubling of happiness, a tripling, a ten-fold increase, or something else? To use an exaggerated comparison, in terms of the New York question for Schelling points, opting for non-linearity is a bit like going to your favourite coffee shop and expecting a stranger would go there too.
Regarding endpoints, individuals might reason that, to be cooperative, they should use a scale that covers at least the real limits: if say I’m 10/10 today, but expect to be happier tomorrow, my 10/10 then will mean something different. Similar thinking would apply across people: if I know my 10/10 is smaller than yours, my numbers will mean something different to yours. Using a longer-than-actual scale is possible, but impractical: if you pick something arbitrarily longer than actual, you cannot expect others to coordinate with you—at bit like expecting to meet somewhere along 5th Avenue. One non-arbitrary choice is the nomological limits, but that is impractical because it is unclear what they are. Another non-arbitrary choice is the logical limits, but this would be non-sensical given there are no such logical limits. Hence, the obvious Schelling point is to use the real limits for everyone.
Should we expect individuals to know what these limits are? Further research could investigate this, but the assumption seems reasonable: we frequently communicate with each other about what the best and worst moments of life are—wedding, births of children, sporting victories, the death of a loved one, serious physical injuries, etc.—and how these compare to the rest of life. What’s more, even if there are differences, we might expect, on average, a ‘wisdom of the crowds’ effect. Galton (1907) famously observed that when a large group of people guessed the weight of a cow at a country fair, the median answer of the crowd was surprisingly accurate: within 1% of the true answer. By extension, we can anticipate that, in aggregate, individuals’ choices of subjective scale endpoints will approximate the real limits.
That said, one might expect some fraction of individuals would use, not the real limits, but their own personal limits, for the scale endpoints. This might occur if they do not try hard to coordinate with others and/or find it easier to access their own limits. As it happens, this may not make much practical difference anyway: presumably even relatively sheltered lives contain moments of intense joy (e.g., orgasms, the exhilaration of succeeding at something) and suffering (e.g., the death of a loved one) that fall close to real limits. If some individuals use the real limits, whereas others use their own personal limits, that may lead to some distortion of cardinality. Therefore, it is worth investigating to see how stark these differences are and what limits people take themselves to be using.
If the central hypothesis—that the individuals do converge on a linear reporting function and the real limits as the scale end-points—is correct, the subjective scales will be cardinally comparable (for the reasons given in section 4).
The Gricean idea that we should understand individuals, when faced with vague subjective scales, as trying to communicate cooperatively, is not novel. However, it does not seem to feature in the recent SWB literature on cardinality—the only paper I know that refers to either Grice (1989) or Schwarz (1995) is Ferrer-i-Carbonell and Frijters (2004), which mentions only the latter, and does so in passing. Hence, this is a reintroduction of Grice’s ideas. As far as I know, the suggestion that subjective scale interpretation be understood, game theoretically, as a search for Schelling (or ‘focal’) points is novel. With it, we have an intuitive and specific explanation how individuals would interpret subjective scales. Individuals are not simply answering at random. They are doing what they do in other cases of communication, which is to try and make themselves understood.
7. Assessing the conditions
The foregoing discussion was both theoretical and high-level; now, we discuss, in turn, each of the four conditions and consider the empirical evidence. I argue these indicate each of the four conditions is true.
7.1 Condition 1: Phenomenal Cardinality
As noted, if the subjective phenomenon at hand is not perceived in units of intensity, there could not be a cardinal measure of it.
Regarding happiness, it is introspectively obvious we can assign magnitudes to the intensities of sensations. This is reflected in our language. As Ng (1997, 1852) points out, we do think it is coherent to make claims of the following type, “being thrown in a bath of sulphuric acid would feel at least twice as bad as stubbing my toe”. Ng observes it is often hard to make these comparisons precisely but notes that this poses no threat to there being, in reality, precise cardinal differences. That I do not know how many times heavier Mount Everest is than Mont Blanc should not lead us to conclude there is not a precise fact of the matter about their relative weights.15 In other words, the vagueness is epistemic, not metaphysical. I am grateful to Caspar Kaiser for this suggestion. If happiness were ordinal then all that could be said was that the sulphuric acid bath was worse than the toe-stubbing, not that it was worse by some degree.
One criticism of hedonism, the view well-being consists in happiness, is the heterogeneity objection: pleasurable experiences, such those from reading a book, falling in love, or eating ice-cream are so different that there is no single, common scale we can put them all on (Heathwood, 2006; Nussbaum, 2012). However, as Crisp (2006) straightforwardly counters, all these experiences do seem to share a common property, pleasurableness, or ‘hedonic feeling tone’, and this admits of degree, even if these experiences are nevertheless qualitatively different in some respect. Theorising in evolutionary biological term supports this: a single reward (pleasure) and punishment (pain) scale is needed to make choices consistent with maximising fitness (i.e. survival and reproduction) (Perez-Truglia, 2012; Ng, 2015). It is also indicated by the fact that non-response rates for happiness and life satisfaction questionnaires are about 1% around the same as the non-response rates questions about for marriage or unemployment (Smith, 2013). If individuals thought the task of scoring their happiness was baffling, they wouldn’t do it. Hence, people do not seem to find their pleasures too heterogeneous to put them on a single scale.
What’s more, it doesn’t seem that the feature of having units of felt intensity is peculiar to happiness or life satisfaction. Hence, to the critic who disbelieves condition 1 applies to happiness, the question is whether it fails for other subjective states—such as tastiness, loudness, brightness, etc.—and, if so, what the relevant difference is.
7.2 Condition 2: Linearity
In section 3, we noted that, the obvious choices for an individual’s reporting function are for it to be linear, logarithmic, or arc-tangential.
There are several distinct lines of analysis which point to a linear reporting function. The first is that individuals seem to treat bounded scales of objectively measurable properties as linear. Oswald (2008) asked respondents to rate their own height relative to their gender, on a horizontal line labelled “very short” on the far left and “very tall” on the far right. Ten small equidistant vertical dashes were marked as a visual aid. The objective height of the participants was also measured. The correlation between subjective and objective height was very high (0.8) and regression equations found the relationship between subjective and objective height was effectively linear.
We might wonder if people do the same for properties which are not objectively measurable, such as feelings. Relevant to this, van Praag (1991) gave subjects given ordered evaluative verbal labels (“very bad”, “bad”, “not bad”, “not good”, “good”, “very good”) and asked subjects to place this on a cardinal numerical scale labelled “1” and “1000”. The general pattern across individuals was to place the labels so they were roughly equal distances apart on the scale; in other words, individuals constructed a cardinal scale with the ordered subjective data.16 Note that this finding leaves open whether each individual’s scale had the same range and/or covered the same levels.
A third, compelling piece of evidence, but one whose relevance to linearity is not immediately obvious, derives from the homoskedasticity of errors in subjective reports. Krueger and Schkade (2008) conducted a test-retest of net affect—individuals are, in effect, asked how happy they are one day, asked again a week later, and the results are compared. What we would expect to find is that individuals’ happiness varies by about the same, week to week, regardless of their starting level of happiness—we do not observe those who are very happy have wild swings in their moods whilst those who are unhappy have small changes, or vice versa. More technically, we would expect homoskedasticity, that is, for the error in the regression model to be constant as the value of the predictor variable changes, in experienced happiness. Krueger and Schake find that the test-retest differences for reported levels of net affect are homoskedastic.17 At p.18 they note “assumption of homoskedastic measurement error could be violated, but the deviation is probably slight”. The simplest conclusion for this observation is that there is a linear relationship between experienced and reported happiness.
To be clear, homoskedasticity in the reported data is logically consistent with non-linear reporting, but it makes alternative explanations unlikely. To illustrate, suppose someone believed there was a logarithmic reporting relationship and, for concreteness, one where every 1-point reported change indicated a 10-fold increase in happiness. To make this consistent with the observation of homoskedasticity in the reported data, such a person would need to believe the week-by-week fluctuations in levels of happiness is 10 times larger for someone who reports a 9/10 than an 8/10. Although this is logically possible, this seems empirically implausible.18 I also note one not-so-compelling empirical argument made for linearity. Kristoffersen (2017) compares life satisfaction to scores on a standardised mental health questionnaire (MH5), finds their relationship is effectively linear, and claims this supports the linear reporting of SWB. This claim relies on granting the assumption that scores of the mental health questionnaire are meaningfully cardinal, such that we can use those as a test. However, it is not clear why we should grant this assumption. The mental health survey used involved aggregating several qualitatively different questions (e.g. “have you been a nervous person?” with “have you felt so down in the dumps nothing could cheer you up?”) and weighting those by answers by how much of the time they have been experienced. This is standardised onto a 0-100 scale. I do not see why we should believe that this is a cardinal scale, where each 1-point change represents an approximately equal change in ‘mental health’ (a term which itself is vague and not clearly cardinal in nature). As such, I doubt this evidence should convince someone who is already sceptical about cardinal scales for subjective states.
Some evidence points against linearity. Lantz (2013) finds that the perceived distance between points on a 5-point Likert-style scale depends on how verbal anchors are used. For instance, using anchors only at the ends leads subjects to perceive a relatively larger distance between points near the ends of the scale than in the middle, i.e. going from 4 to 5 is larger than going from 3 to 4.
However, subjects were not asked how big the perceived difference was, only if they perceived one at all. That there are slight differences is consistent with evidence given above, which indicates the reporting function is linear, or at least sufficiently close to it we do not observe an alternative that would be more accurate. Further research should investigate the magnitudes of perceived differences.
Furthermore, although I can see why someone might want to use logarithmic or arc-tangential reporting functions, I am unaware of any non-anecdotal evidence that indicates individuals do, in fact, use them.19 I note Ng (2008) offers a hypothesis, but not evidence. See also Gómez-Emilsson (2019) for some anecdotal reasoning. As already noted, in light of the earlier Schelling point story, this is perhaps not a surprise: we could not expect others would use the same non-linear function as we would choose.
Two issues lurk. The first is to explain why one might think there is a logarithmic reporting relationship. The confusion perhaps arises from misunderstanding the Weber-Fechner law in psychophysics. That law describes relationship the between an objectively measured stimulus and a reported subjective intensity. Here, we are concerned about the relationship between experienced intensity and reported intensity. Hence, we have three relata—(1) changes in objective stimuli, (2) changes in reported experience; (3) changes in actual experience—and we are inquiring about their relationships.
In the psychophysics experiments, the normal interpretation is that when someone reports a 1-unit subjective increase in intensity—due to e.g. turning up the volume threefold on the speakers—they do, in fact, experience a 1-unit subjective increase in intensity: that is, there is a linear reporting relationship between (2) and (3). It is because we assume a linear reporting relationship that, when we observe a logarithmic relationship between objective stimulus and reported intensity (i.e. (1) and (2) we feel confident enough to assume a logarithmic relationship between objective stimulus and experienced intensity (i.e. (1) and (3). Hence, it is deeply puzzling for someone to claim the Weber-Fechner law is evidence against linearity in the reporting function because, in fact, the Weber-Fechner law assumes linearity in the reporting function to derive its further conclusion about the relationship between objective stimuli and subjective experience!20 The other possible explanation is that each doubling of objective stimulus in fact causes a doubling of subjective intensity but that individuals only report a 1-unit increase per doubling because the relationship between reported and experienced intensity is logarithmic. This is, in effect, the opposite pair of assumptions from those normally made. I do not think this possibility has been seriously entertained, precisely because we believe individuals can detect equal-interval changes in subjective intensities and honestly report them when they occur. 21 I thank an anonymous reviewer for observed a further difference is that the Weber-Fechner law concerns the relationship between objective stimuli and subjective experience and is not subject to the confined of a 0-10 scale.
The second issue is where Bond and Lang’s (2019) critique fits into this. Cutting through the complicated mathematics, Bond and Lang make a hypothetical argument of the following type: if one rejects the assumption that the relationship between actual and reported SWB is linear, it is possible to reverse many of the key findings in the SWB literature. According to Kaiser and Vendrik (2020), the specific argument Bond and Lang use is as follows. As happiness is logically unbounded but individuals have only limited numbers of labels, reports in the top(/bottom) category could potentially be infinitely large(/small). Hence, an individual who reports being in the top category—say 10/10—may have an actual level of happiness that is hundreds or thousands of times higher than other individuals also in that top category or the categories below. Under these conditions, it is trivially easy to reverse any result which had assumed the scale is linear (i.e. had equal-interval cut-offs) by making suitably ‘heroic’ assumptions about the actual happiness levels of those in the top and bottom categories.
Bond and Lang (2019) do not, however, provide any evidence for their hypothetical argument. As we have seen, the hypothesis they rely on—non-linear reporting—looks implausible given the evidence. It is hard to believe individuals would use anything other than a linear reporting function if they wanted to be understood by others.
7.3 Remarks on conditions 3 and 4
Having established that C1 and C2 are likely met, the further question is whether subjective scales are cardinal, not just intratemporally and intrapersonally, but intertemporally and interpersonally. C3 and C4 require that individuals use the scales in the same way; more specifically, that they use the endpoint to represent the real limits. Why do we think individuals are willing and able to use the real limits as endpoints? This section offers broad-brush support for this claim. This leaves open specific doubts regarding each condition, which are dealt with in subsequent sub-sections.
One line of evidence comes from asking individuals, in the US, to rate, on a scale from 0, ‘very negative’, to 10, ‘very positive’, how positive or negative various words are, such as ‘terrible’, ‘awful’, ‘average’, ‘excellent’, and ‘perfect’ (YouGov, 2018). When numerical answers are plotted as a distribution, it is clear there is very substantial, although not universal, agreement on the numerical score of words; from this it also follows there is a consensus around the intensity of the ends of the scales.
This result should be unsurprising. After all, the purpose of language is to communicate, which requires that our words have a shared meaning, one determined by their use (Wittgenstein, 1953). That we achieve this consensus is less mysterious when we realise that we often regulate each other’s use of appropriate language, the process of meta-linguistic negotiation—for some discussion, see Plunkett (2015). For instance, if I were to say, in all earnestness, “I got a papercut, I am in agony”, I might expect the response, “come on. That’s not what agony feels like.” Further, if verbal labels communicate our intensity of emotions, we should expect that intensity can also be conveyed numerically.
What would we observe if we people didn’t use words in the same way? If word intensity were perceived at random, there would be an even distribution. If people used ‘very negative’ and ‘very positive’ to refer to the nomological or logical limits of intensity, then the distributions for every word would be concentrated around 5, the scale mid-point. There are some odd results: some people rate every word, from ‘terrible’ to ‘fair’ to ‘perfect’ as being 5/10 (of course, these could be different individuals). This may be the result of disinterested respondents more so than sincere, but different, beliefs about word meaning.
Building on this, evidence of similar international language comes from comparing the study just mentioned, which was conducted in the US, to an identical one in the UK (YouGov, 2018). When the numerical results were averaged, the differences between the US and UK scores for 31 words were often fractions of one unit apart, e.g., to pick largely at random, ‘good’ was 6.92 in the UK and 7.08 in the US. It is hard to believe that those countries which share a language will have starkly different scale use.
Neither of these two studies directly inform our understanding of whether people use the actual limits when reporting their SWB. However, worldwide distribution of subjective well-being scores do support this. These follow an approximately normal distribution with responses in all the categories, as displayed in Figure 4. Why does this suggest the reported maximum and minimum represent the real maximum and minimum? Recalling the discussion a moment ago, if people were using the logical or nomological limits, the self-reports would be compressed into the middle of the scale. Conversely, if people’s scales were sub-actual, for instance if they used 10/10 to mean their (say) average happiness, then we would see a ‘bunching’ with lots of scores at ends of the scale. If people’s scales used the actual range, and their experiences are roughly normally distributed (which seems plausible), then we would expect to see reported SWB to be roughly normally distributed and for these scores to use the full range. This is just what we see. Hence, the data indicate that individuals are, broadly speaking, accurately reporting their subjective well-being and that they are using the ends of the scale to represent the real limits.
I only say, ‘broadly speaking’, however and raise three issues. First, there is, in fact, some bunching in the top category, both looking at worldwide distribution of life satisfaction scores and in all sub-regions; more people say they have the top level of satisfaction than we would expect from a normal distribution. It is unclear if this represents accurate reporting, a positivity/self-delusion bias that should be corrected for, or something else. This is a topic for further research.
Figure 4: Worldwide distribution of Cantril ladder scores

Note: These are generated by the following prompt: “Please imagine a ladder, with steps numbered from 0 at the bottom to 10 at the top. The top of the ladder represents the best possible life for you and the bottom of the ladder represents the worst possible life for you. On which step of the ladder would you say you personally feel you stand at this time?” Graph reproduced from World Happiness Report 2017 (Helliwell, Layard and Sachs, 2017).
Second, there is some evidence that individuals use their own previous happiness, rather than the happiness of others, as the reference points when answering happiness questionnaires (Steffel and Oppenheimer, 2009). As this is from a small, convenience sample of American college students, it should carry less weight than a global survey.
Perhaps relatedly, in the realm of health, there is evidence that people rate ‘perfect health’ relative to their age group, rather than the best health possible for anyone of any age (Schneider and Stone, 2016). It is unclear if this is specific to health. Speculatively, as heath varies so much between ages, respondents may expect the helpful way to answer the question is with reference to their age group. Clearly, we do not always use ourselves over time as the reference points. If I ask, as Oswald (2008) did, how tall you are on a 0-10 scale, it would be perverse to say “10/10” just because you are currently the tallest you have ever been. Hence, these are two further topics for further research.
Third, even if the general pattern is for individuals to use the end points to represent the actual limit, this is consistent with various groups having different scale-lengths and levels, or people having different lengths and levels at different times. Hence, we need to say more about intertemporal and interpersonal comparisons.
7.4 Condition 3: Intertemporal Comparability
Do people use the same scale over time—might a ‘6/10’ mean something different at different moments? Here, we need to distinguish between contextual factors—those related to the survey itself—and acontextual factors.
The psychological literature details several contextual factors that affect responses to subjective well-being questions, such as finding a coin, being asked about your love life, your satisfaction with politics, or whether you are surveyed in person or over the phone (Schwarz and Strack, 1999; Deaton, 2012; Dolan and Kavetsos, 2016).
Contextual factors pose no problem for intertemporal cardinality. Not only do mood and item-order effects have a relatively small impact, if questionnaires are asked in a standardised way, any contextual effects will ‘wash-out’ on average (Eid and Diener, 2004; Schimmack and Oishi, 2005).
A genuine threat is posed by acontextual factors. Ng (2008) observes that happiness researchers seem not to have noticed that individuals can rescale—alter what their scale’s endpoints represent—over their lives.
It is important to differentiate rescaling from (hedonic) adaptation, where the subjective impact of some event reduces over time. To illustrate, suppose Sam, a professional tennis player, reports he is 8/10 happy now. Sam then has an accident and is unable to play tennis. He is surveyed a year later and says he is 8/10 happy. One possibility is he had adapted to his new life and is genuinely as happy. Another is that he is less happy but has rescaled—specifically, he has shrunk his scale, lowering the level of happiness a 10/10 represents. A third is that some combination of rescaling and adaptation has occurred. To be clear, adaptation poses no threat to intertemporal cardinality as the same numbers still represent the same intensities of experiences.22 A separate worry, which originates from Sen (198, 45-6) concern the fact that people are (or could) be happy in deprived circumstances. If we think such people are happy but have low well-being, that means well-being cannot consist in happiness. This is not our concern here.
While there is a literature on reported adaptation to life shocks, e.g. divorce, unemployment, etc., authors seem to explicitly or implicitly assume intertemporal scale cardinality, rather than argue for it, and hence conclude adaptation genuinely occurs where it is reported. See Luhmann et al., (2012) for a review of adaptation that makes this assumption. I am unaware of any substantial discussion of whether reported adaptation is better explained by rescaling, genuine adaptation, or some combination of the two. As an example of a typically brief discussion, Oswald and Powdthavee (2008, 16) state only that “There is probably no way to reject such concerns [about rescaling] definitively, but one objection to it is that in our data there is a continuing negative effect from longstanding disability; this seems inconsistent with the claim that disabled people fundamentally rescale their use of language”.
To make progress here, we need to draw on and/or develop our theories of how adaptation and rescaling work to better determine what would constitute evidence of one, rather than the other, occurring.
Starting with rescaling, I am not aware of any detailed suggestions of how, when, and by how much, rescaling might occur. Based on the earlier theory that individuals want to make themselves understood, I expect that individuals will be reluctant to rescale and will only do so if forced to by new evidence. Hence, we would only expect individuals to rescale if they experience events that are both extreme and unexpected; if they had correctly anticipated the event, they would already have made their scale wide enough to accommodate it.
How many extreme, unexpected events do people run into? Intuitively, not many; we would expect people to have some idea of what the range of human experiences are—the joys of sex and love, the horrors of war and suffering—either first-hand or from others’ reports. In this case, we would not expect to see much rescaling at all.
An alternative possibility is that individuals are frequently surprised by the subjective intensity of events. In this case, we would see rescaling occur to all sorts of major events as individuals recalibrate their endpoints.
One way to test specifically for rescaling would be to ask a range of people if they had rescaled and, if so, why and by how much. Another would be to find, in panel data sets, those who we expect would have had rescaling events—e.g. extreme pain. If, for those people, we later observed changes in other variables from which we would not expect rescaling—e.g. changes in income or relationship status—were associated with smaller than usual changes in subjective well-being, that would indicate a stretching of scales. These are topics for additional study.
Regarding hedonic adaptation, there are good evolutionary reasons to expect this occur, but only for some events; for more detailed discussions, see Graham and Oswald (2010) and Perez-Truglia (2012). The idea is that affective states are ‘Mother Nature’s’ way to punish/reward animals for actions that increase/reduce our ability to survive and reproduce. Producing these sensations is costly in terms of energy, so hedonic adaptation is the solution that reduces costs whilst maintaining motivation. Hedonic adaptation can occur at the cognitive level too—people change their views on things (Wilson and Gilbert, 2005). We wouldn’t expect hedonic adaptation to occur in response to a situation that continues to be good/bad for the creature’s survival and reproduction; for instance, it would be disadvantageous to fully adapt to pain, as then pain would not be serving its warning function. As evidence of pain’s usefulness, those with congenital immunity to pain, a rare medical condition, often end up severely damaging themselves (Udayashankar et al., 2012).
Turning to the survey data, what we see from life satisfaction scores is that people report adaptation to some things—e.g. becoming bereaved—and not to others—e.g. being unemployed or disabled (Clark et al., 2008; Luhmann et al., 2012; Clark et al., 2018). If people were often surprised at how good/bad extreme experiences were (the second hypothesis) then we would instead observe reports of adaptation across the board. Further, when we look at which events people do and do not reportedly adapt to, these fit our evolutionary hypothesis of adaptation: we can understand why disability and unemployment would keep being be bad—the former makes life difficult, the latter feels shameful, and both increase isolation—and why (most) people eventually adjust to bereavement—it does not enhance survival and reproductive fitness to remain sad and unmotivated to find a new (reproductive) partner.
In light of this evidence, the best inference seems to be that, broadly speaking, people do not rescale.
A further test of rescaling comes from utilising data on memories. Prati and Senik (2020) compare remembered SWB—how satisfied individuals recall being—with observed past SWB—how satisfied individuals they said they were at the time. Specifically, they analyse data from respondents of a German panel, who had been asked about their life satisfaction for years, were given the nine different pictures of changes in life satisfaction over time (see Figure 5) and asked to pick one which best represented their own life.
Figure 5: Potential patterns of recalled satisfaction

Figure 6 displays, for each group that picked a schematic pattern, what their average observed life satisfaction was.
Figure 6: Average observed life satisfaction

It is worth stressing this is an extremely cognitively demanding task and the individuals were only given a limited range of options to pick from. The match between the patterns of recalled and observed past satisfaction is thus extremely impressive.
What does this tell us about whether rescaling occurs? If we accept there is consistency between remembered and observed past satisfaction, there seem to be only two ways to explain this.
Either (A) individuals both use the same scale over time and have good memories or (B) individuals change the scale use and have bad memories. If individuals used the same scales and had bad memories, or used different scales and had good memories, there would be an inconsistency between the recalled and past observed patterns. Prati and Senik (2020) highlight the first but not the second possibility.
Of the two options, (A) is the more elegant answer than (B): (B) requires not only that individuals change their scales over time—which, as noted, they may want to resist doing to ensure comparability of their answers—but that they also have poor memories. In fact, (B) requires quite specific and implausible patterns of memory failure.
To illustrate, suppose you are quite satisfied, and your satisfaction level has been flat over time. This is shown by the horizontal arrow in Figure 7a. Also suppose that the maximum level of your life satisfaction scale has shrunk, illustrated by the change in length of the vertical arrows in Figure 7a. Because of this, your reported 0-10 level of satisfaction had therefore been rising over time (Figure 7b). To make your patterns of observed past satisfaction and recalled satisfaction consistent, given this upper-bound scale shrinkage, you would need to falsely recall that your satisfaction has increased (Figure 7b). If you instead erroneously recalled that your satisfaction had decreased, then there would be inconsistency between observation and recall.
Figure 7a: Flat actual SWB over time with rescaling

Figure 7b: Changes in reported numerical scores resulting from constant actual SWB over time combined with rescaling

The same specificity applies the other way around. If your experienced satisfaction was flat but your scales had, in fact, stretched, then your reported satisfaction would go down; to make that consistent with recalled satisfaction going down, you would need to falsely recall a decrease in satisfaction.
While it is possible to imagine we have some memory failures, it seems unlikely that rescaling would regularly be associated with a particular direction of memory failure. The most plausible hypothesis, then, is that individuals do use the same scales over time. Or at least, this indicates that dramatic rescaling does not occur and hence it is reasonable, in practice, to assume the data is approximately cardinally comparable over time.
A tension here is that Prati and Senik’s (2020) main conclusion is that individuals do exhibit a present bias in memory: those who are satisfied now are likely to recall being more satisfied than they said at the time. To derive this result, the authors assume intertemporality. The oddity here is how to make consistent the belief that (a) our memories are good (as evidenced by the match between the patterns of recalled and past observed satisfaction) with (b) that they are not that good (as evidenced by the present bias). This is issue for further investigation.
7.5 Condition 4: Interpersonal Comparability
The final condition is whether different individuals use the same endpoints at a time. There are two types of concern here.
The first is whether there are what Nozick (1974, 41) called ‘utility monsters’, individuals who can and do experience much greater magnitudes of happiness (or any other sort of subjective state), than others. Hence, their real limits would be different from those of others, causing issues for comparability.
I won’t dwell on this as it seems likely there would be few such individuals. Presumably, there are evolutionary pressures for each species to have the same range of sensitivity that is optimal for their survival. To return to an example noted earlier, being immune to pain is an extremely problematic condition that would put someone at an evolutionary disadvantage. Further, even if there are differences, we would expect these to be randomly distributed and so wash out.23 It is worth noting that we might well expect there to be large differences between (a) current humans and both (b) non-human animals and (c) humans’ whose genetics has substantially changed either naturally, due to the passage of much time, or deliberately through gene editing. It is an open question whether and how we could make cardinal comparisons between these groups. Possibly we could count the ‘just perceivable increments’, as noted in footnote 13.
The second concern is whether, continuing the terminology, there are ‘language monsters’, those who systematically use language very differently from each other. It seems unlikely there would be substantial, non-random differences between individuals within the same linguistic community for the reasons given earlier (section 5.3), although this should be investigated. However, even if the users of a language successfully share meaning, we might still expect there to be systematic differences between linguistic groups, i.e., different cultures and/or nations.
There are mean-level differences in SWB across countries (Helliwell, Layard and Sachs, 2017). As Diener et al. (2017) observe, these could be explained by the underlying differences in those countries—which include how its culture affects quality of life—or by culture-specific differences in reporting style, or some combination of the two. Only the latter is a problem for CT. Are there culture-specific reporting differences?
Earlier work in this area relied on somewhat limited comparisons and provided indicative—rather than conclusive—evidence that reporting differences were small or non-existence. For instance, Diener et al. (1995) investigate and reject several potential reporting differences between US and Asian students, such as that Asians report lower scores simply because their culture emphasises individuals not standing out. Ouweneel and Veenhoven (1991) conduct various tests, such as checking if language groups in the same country—e.g. French- vs English-speaking Canadians—have different scores; they find only small differences. Both comparisons are limited in scope; in the case of the latter, it remains unclear whether observed differences are due to difference between the groups (including their culture) or to response style.
A piece of evidence indicating a shared global reporting pattern comes from the worldwide distribution of scores (see figure 4 again); namely, that the most developed countries have higher life satisfaction, and these scores gradually decrease in line with expectations as develop is lower. If (say) Sub-Saharan countries reported higher scores that Western Europe, we should worry people in different places are not using the same scale.
In the literature, three methods seem to have been proposed to conclusively identify if there are global differences in reporting style. I will briefly explain these and what has (purportedly) been found using them. The results are inconsistent, so I then explain when the third method relies on questionable assumptions.
The first is what we might call variable equivalence, where we assume that the same variable—income, partnership, employment, etc.—has the same true impact in different places, at least if we control for the other variables. If we accept this then, if the coefficients of the explanatory variables have the same size in different places, that indicates scales are the same range.24 I am grateful to Caspar Kaiser for pointing out this would leave open what levels the scales covered. If we instead found, for instance, that the variables had half the coefficient size in France as Germany, we should assume the French have a scale that was twice as wide—the less likely alternative would be if they have the same reporting functions but life changes had uniformly half the impact on the French.
In an analysis of this type, Helliwell et al. (2009) examined the predictors of life satisfaction across nations—e.g. income, levels of social capital, corruption—and found that the regression equations were effectively the same world over. In other words, the same things mattered in one place as another, and mattered by similar amounts, when we try to explain differences in reports of subjective well-being. If we grant variable equivalence, that suggests different parts of the world use scales of the same length.
The second method for testing interpersonal comparability is to observe reported changes from migrants to a country. If we assume intertemporal consistency, any changes will be down to the real differences caused by living in one society compared to another.
Helliwell, Bonikowska and Shiplett (2016) studied immigrants moving from over 100 different countries to Canada and found that, regardless of country of origin, the average levels and distributions of life satisfaction among the immigrants mimicked those of the Canadians. As their reports converge with those of each other, and the extant Canadians, that indicates that despite different cultural backgrounds, the individuals have the same scales as each other. We might wonder if this is instead the result of immigrants adopting the cultural norms of their new country. However, given immigrants from different places had different levels of SWB prior to arrival, they only way the pattern of immigrant SWB would mimic that of the Canadians would be if the immigrants entirely adopted the cultural norms of their new home; if they only partially adopted the norms, the SWB patterns would not mimic those of the Canadians. It seems unlikely we should expect all immigrants to fully integrate in this way.
It is hard to believe this could be to individuals’ scale changes: to get the same observed pattern, individuals with different previously observed levels of SWB would need to engage in different sized scale-shifts such that there happened to be a convergence; this is incredible, absent some explanatory mechanism.
The third method is vignettes, where survey participants are given a description of someone’s life and then asked to rate how satisfied that person is. Here is an example vignette taken from Angelini et al. (2014)
John is 63 years old. His wife died 2 years ago and he still spends a lot of time thinking about her. He has four children and ten grandchildren who visit him regularly. John can make ends meet but has no money for extras such as expensive gifts to his grandchildren. He has had to stop working recently due to heart problems. He gets tired easily. Otherwise, he has no serious health conditions. How satisfied with his life do you think John is?
If we assume vignette equivalence, that all individuals think the person in the vignette has the same underlying experience of life, then then difference in reports will be due to differential scale use (King et al., 2004).
Kahneman et al. (2004) observe surprisingly large differences in European data: for example 64% of Danes say they are “very satisfied” but only 16% of the French do. Angelini et al. (2014) provide vignettes to individuals in different European countries and find relatively large response patterns to those vignettes. When these are accounted for and the scales correspondingly ‘corrected’, the differences between the Danes and the French (as well as many other nations) disappear. This indicates a lack of intercountry cardinality.
How should we resolve these inconsistent results? The guilty party here seems to be the vignette approach. This method does not prove there is differential scale use, so much as starts with the assumption there is differential scale use, then applies vignette equivalence as the suitable way to correct for it. But it is not obvious there is differential scale use. Specifically, whilst the headline comparison—that 64% of Danes, but 16% of French are ‘very satisfied—looks, initially, as if it must be a mistake due to differential national reporting styles, it ceases to seem so when one considers average life satisfaction. In Denmark, this is around 7.6(/10) compared to 6.6 for France (Helliwell, Layard and Sachs, 2019). Given it a whole point higher in Denmark, it is no longer surprising so many more Danes have been ‘squeezed’ into the top verbal band of ‘very satisfied’.
What is more, while one explanation for the fact that different people give the same vignette different scores is that they use different scales, another—I claim better—explanation is that individuals simply disagree over how well life is going for those depicted in the vignettes. Angelini et al., (2014) find about 30% of Germans rate ‘John’ from the above vignette as ‘satisfied’ or ‘very satisfied’, but 30% rate him ‘dissatisfied’ or ‘very dissatisfied’. It is very hard to believe that, if one person says John is ‘satisfied’, and another says he is ‘dissatisfied’, then they agree how his life is going, but disagree on the meaning of ‘satisfied’. It seems far more likely they agree on the meaning of words but disagree how John’s life is going—this is particularly so given the evidence mentioned in 7.3 about the agreement on the numerical values of different adjectives. Hence, faced with a choice of vignette equivalence or what we might call semantic equivalence, respondents attaching the same meaning to words, the latter seems more plausible.
Now we have abandoned the assumption of vignette equivalent, the remaining evidence points towards the conclusion there is a shared international scale for SWB.
8. Does the existing evidence support the Cardinality Thesis? What further tests could be done? What would we do if it were false?
That concludes the survey of the existing evidence. While the evidence base is perhaps uncomfortably sparse in places, we find support for each of the conditions and no ‘smoking gun’ data that indicates one, or more, of the conditions, that it fails by enough to be noticeable. It is consistent with this that further analysis, using precise statistical methods, will find some deviations. However, it seems reasonable to assume that CT is true unless and until new evidence suggests otherwise.
The final issues to comment on are how to further test the CT and what we should do if the conditions fail.
As noted, if C1 did not obtain, that would be ‘game over’ for cardinal measurability. However, we saw earlier that C1 does seem to obtain; it is unclear what further testing would or could usefully be done for it.
Let us turn then to C2-4, those conditions regarding reporting behaviour. The Grice-Schelling hypothesis requires that individuals interpret scales in a very particular way. Hence, two obvious, and I believe uninvestigated, avenues are to directly ask individuals how they think they use subjective scales—specifically, what reporting function and endpoints they use—and to experimentally infer how people use them.
One option would be to give individuals a choice of different reporting functions and scale endpoints and then ask them to state which one is most similar to their own. For instance, whether they think 10/10 refers to the “happiest they’ve ever been”, “the happiest they could be in reality”, “the happiest anyone alive today could be in reality”, “the happiest anyone could possibly be within the laws of nature”, and so on. It would support the Grice-Schelling hypothesis if we found that individuals believed they use linear reporting functions and the real limits for the endpoints. Relatedly, individuals could be asked how they expect others to interpret subjective scales. Qualitative questions about why they picked their choices would also be illuminating. Even if we are worried that individuals think they behave in one way, but in fact behave in another, such research would have some value and build the evidential picture.
The other, related avenue is to infer individuals’ choices from their behaviour. Differently labelled scales could be presented, both to the same or to different groups of individuals, and those individuals asked to give ratings for themselves. For instance, respondents could be asked to rate their happiness on a series of 0-10 scales, where the 10s are left unlabelled, or marked “the happiest you’ve been so far”, “the happiest any human has ever been in history” and so on (with equivalent markings for 0). The reporting function could be tested in a similar way: the same and different individuals would be presented with an array of explicitly specified or entirely unspecified options and asked to give subjective ratings. We would then conclude that the labelled scale and reporting functions which have answers most similar to the unlabelled ones would be how individuals, by default, interpret subjective scales. If, for instance, scores were most similar between the unlabelled reporting function and the reporting function labelled as linear, this would support CT.
If we find any of C2-4 have gone awry, we can correct for this. If believe there is a deviation from one or more of them and, further, have a method for quantifying it size or shape, then we can correct for it, and returning to the analogy, bend back the measuring sticks. Indeed, we have discussed an, admittedly misguided, example of this: the assumption of vignette equivalent allowed Angelini et al. (2014) to ‘correct’ the self-reports of those from different nations.
Is there some deviation from cardinality we could be confident existed, but not correct for? I cannot prove there is not, but I cannot think of one. The two places the scale interpretation could ‘go wrong’ relates to the reporting function and the scale endpoints. But, as the further tests noted show, we can directly investigate how far individuals’ behaviours deviates from the conditions. There are perhaps other, more inventive ways to do this.
9. Conclusion
This paper has offered a first comprehensive theoretical and empirical review of the cardinal comparability of subjective scales. After explaining the background debate and state of the literature, it systematically worked through the various questions that needed to be addressed to determine whether subjective scales are cardinally comparable. It specified the various necessary and sufficient conditions for cardinal comparability, then explained what it would mean if each conditions failed and how we can assess whether or not they obtain. It proposed a theory of how individuals might intuitively interpret subjective scales in order to be understood and how this would lead to their answers being cardinally comparable. It assessed the evidence and reached the tentative conclusion that it is reasonable to understand subjective scales as cardinally comparable. It closed by noting that if a lack of cardinality in the ‘raw’ subjective data existed it would fixable and set out directions for further work.
Bibliography
Alexandrova, A. and Haybron, D. M. (2016) ‘Is Construct Validation Valid?’, Philosophy of Science. University of Chicago PressChicago, IL, 83(5), pp. 1098–1109. doi: 10.1086/687941.
Angelini, V. et al. (2014) ‘Do Danes and Italians Rate Life Satisfaction in the Same Way? Using Vignettes to Correct for Individual-Specific Scale Biases’, Oxford Bulletin of Economics and Statistics. Blackwell Publishing Ltd, 76(5), pp. 643–666. doi: 10.1111/obes.12039.
Benjamin, D. et al. (2020) What Do Happiness Data Mean? Evidence from a Survey of Happiness Respondents*. Available at: http://users.nber.org/~heffetz/papers/BDFHK.pdf (Accessed: 16 September 2020).
Bentham, J. (1789) An introduction to the principles of morals and legislation.
Blanchflower, D. G. and Oswald, A. J. (2004) ‘Well-being over time in Britain and the USA’, Journal of Public Economics, 88(7–8), pp. 1359–1386. doi: 10.1016/S0047-2727(02)00168-8.
Boyd, R. (1980) ‘Scientific Realism and Naturalistic Epistemology’, PSA: Proceedings of the Biennial Meeting of the Philosophy of Science Association. The University of Chicago PressPhilosophy of Science Association, pp. 613–662. doi: 10.2307/192615.
Bronsteen, J., Buccafusco, C. J. and Masur, J. S. (2012) ‘Well-Being Analysis vs. Cost-Benefit Analysis’, SSRN Electronic Journal. doi: 10.2139/ssrn.1989202.
Clark, A. E. et al. (2008) ‘Lags and leads in life satisfaction: a test of the baseline hypothesis’, The Economic Journal, 118(529), p. F243.
Clark, A. E. et al. (2018) The origins of happiness : the science of well-being over the life course.
Crisp, R. (2006) ‘Hedonism reconsidered’, Philosophy and Phenomenological Research, 73(3), pp. 619–645.
Deaton, A. (2012) ‘The financial crisis and the well-being of Americans’, Oxford Economic Papers. Cambridge, MA, 64(1), pp. 1–26. doi: 10.1093/oep/gpr051.
Diener, E. et al. (1995) ‘National differences in reported subjective well-being: Why do they occur?’, Social Indicators Research 1995 34:1. Springer, 34(1), pp. 7–32. doi: 10.1007/BF01078966.
Diener, E. et al. (2017) ‘Findings all psychologists should know from the new science on subjective well-being.’, Canadian Psychology/Psychologie canadienne, 58(2), pp. 87–104. doi: 10.1037/cap0000063.
Diener, E., Lucas, R. E. and Oishi, S. (2018) ‘Advances and Open Questions in the Science of Subjective Well-Being’, Collabra: Psychology, 4(1), p. 15. doi: 10.1525/collabra.115.
Diener, E. and Suh, E. M. (2000) Culture and Subjective Well-Being. MIT Press.
Dolan, P. and Kavetsos, G. (2016) ‘Happy talk: Mode of administration effects on subjective well-being’, Journal of Happiness Studies, pp. 1–19.
Dolan, P. and White, M. P. (2007) ‘How Can Measures of Subjective Well-Being Be Used to Inform Public Policy?’, Perspectives on Psychological Science. SAGE PublicationsSage CA: Los Angeles, CA, 2(1), pp. 71–85. doi: 10.1111/j.1745-6916.2007.00030.x.
Edgeworth, F. Y. (1881) Mathematical Psychics. London: Kegan Paul.
Eid, M. and Diener, E. (2004) ‘Global judgments of subjective well-being: Situational variability and long-term stability’, Social Indicators Research. Springer, 65(3), pp. 245–277. doi: 10.1023/B:SOCI.0000003801.89195.bc.
Ferrer-i-Carbonell, A. and Frijters, P. (2004) ‘How Important is Methodology for the estimates of the determinants of Happiness?*’, The Economic Journal. Blackwell Publishing Ltd, 114(497), pp. 641–659. doi: 10.1111/j.1468-0297.2004.00235.x.
Ferrer‐i‐Carbonell, A. and Frijters, P. (2004) ‘How important is methodology for the estimates of the determinants of happiness?’, The Economic Journal. Available at: http://onlinelibrary.wiley.com/doi/10.1111/j.1468-0297.2004.00235.x/full (Accessed: 20 June 2017).
Frijters, P. and Krekel, C. (2021) A Handbook for Wellbeing Policy-Making: History, Theory, Measurement, Implementation, and Examples. OUP.
Galton, F. (1907) ‘Vox populi’, Nature, 75(1949), pp. 450–451. doi: 10.1038/075450a0.
Gómez-Emilsson, A. (2019) Logarithmic Scales of Pleasure and Pain: Rating, Ranking, and Comparing Peak Experiences Suggest the Existence of Long Tails for Bliss and Suffering – EA Forum. Available at: https://qualiacomputing.com/2019/08/10/logarithmic-scales-of-pleasure-and-pain-rating-ranking-and-comparing-peak-experiences-suggest-the-existence-of-long-tails-for-bliss-and-suffering/ (Accessed: 21 September 2020).
Graham, L. and Oswald, A. J. (2010) ‘Hedonic capital, adaptation and resilience’, Journal of Economic Behavior and Organization. North-Holland, 76(2), pp. 372–384. doi: 10.1016/j.jebo.2010.07.003.
Grice, P. (1989) Studies in the Way of Words. Harvard University Press.
Hausman, D. M. (1995) ‘The impossibility of interpersonal utility comparisons’, Mind, 104(415), pp. 473–490.
Heathwood, C. (2006) ‘Desire satisfactionism and hedonism’, Philosophical Studies, 128(3), pp. 539–563. doi: 10.1007/s11098-004-7817-y.
Helliwell, J. et al. (2009) International evidence on the social context of well-being. w14720.
Helliwell, J., Bonikowska, A. and Shiplett, H. (2016) Migration as a Test of the Happiness Set Point Hypothesis: Evidence from Immigration to Canada. Cambridge, MA. doi: 10.3386/w22601.
Helliwell, J. F. et al. (2021) World Happiness Report 2021. Available at: https://worldhappiness.report/ed/2021/.
Helliwell, J. F., Layard, R. and Sachs, J. (2017) World happiness report 2017. Sustainable Development Solutions Network. Available at: http://worldhappiness.report/ed/2017/ (Accessed: 24 July 2017).
Helliwell, J., Layard, R. and Sachs, J. (2017) World Happiness Report 2017. Available at: http://worldhappiness.report/ed/2017/ (Accessed: 16 May 2017).
Helliwell, J., Layard, R. and Sachs, J. (2019) World Happiness Report 2019.
Hirschauer, N., Lehberger, M. and Musshoff, O. (2015) ‘Happiness and Utility in Economic Thought—Or: What Can We Learn from Happiness Research for Public Policy Analysis and Public Policy Making?’, Social Indicators Research. Kluwer Academic Publishers, 121(3), pp. 647–674. doi: 10.1007/s11205-014-0654-2.
Holtug, N. (2001) ‘On the value of coming into existence’, The Journal of Ethics, 5(4), pp. 361–384.
Kahneman, D. et al. (2004) ‘Toward national well-being accounts’, in American Economic Review, pp. 429–434. doi: 10.1257/0002828041301713.
Kaiser, C. and Vendrik, M. (2020) How threatening are transformations of happiness scales…. 2020–19. Available at: https://www.inet.ox.ac.uk/publications/no-2020-19-how-threatening-are-transformations-of-happiness-scales-to-subjective-wellbeing-research/ (Accessed: 21 September 2020).
King, G. et al. (2004) ‘Enhancing the Validity and Cross-cultural Comparability of Measurement in Survey Research’, American Political Science Review, 98.
Kristoffersen, I. (2010) ‘The Metrics of Subjective Wellbeing: Cardinality, Neutrality and Additivity*’, Economic Record. John Wiley & Sons, Ltd, 86(272), pp. 98–123. doi: 10.1111/J.1475-4932.2009.00598.X.
Kristoffersen, I. (2011) The Subjective Wellbeing Scale: How Reasonable is the Cardinality Assumption?, Economics Discussion / Working Papers. The University of Western Australia, Department of Economics.
Kristoffersen, I. (2017) ‘The Metrics of Subjective Wellbeing Data: An Empirical Evaluation of the Ordinal and Cardinal Comparability of Life Satisfaction Scores’, Social Indicators Research. Springer Netherlands, 130(2), pp. 845–865. doi: 10.1007/s11205-015-1200-6.
Krueger, A. B. and Schkade, D. A. (2008) ‘The reliability of subjective well-being measures’, Journal of Public Economics. Elsevier, 92(8–9), pp. 1833–1845. doi: 10.1016/j.jpubeco.2007.12.015.
Lantz, B. (2013) Equidistance of Likert-Type Scales and Validation of Inferential Methods Using Experiments and Simulations, Electronic Journal on Business Research Methods .
Larsen, R. J. and Fredrickson, B. L. (1999) ‘Measurement Issues in Emotion Research’, in Kahneman, D., Diener, E., and Schwarz, N. (eds) Well-being: The foundations of hedonic psychology.
Layard, R. (2003) ‘Happiness: has social science a clue? Lecture 1: what is happiness? Are we getting happier?’, in Lionel Robbins memorial lecture series.
Luhmann, M. et al. (2012) ‘Subjective well-being and adaptation to life events: a meta-analysis.’, Journal of personality and social psychology, 102(3), p. 592.
Ng, Y.-K. (2015) ‘Some Conceptual and Methodological Issues of Happiness: Lessons from Evolutionary Biology’, http://dx.doi.org/10.1142/S0217590815400019. World Scientific Publishing Company , 60(4). doi: 10.1142/S0217590815400019.
Ng, Y. (1997) ‘A case for happiness, cardinalism, and interpersonal comparability’, The Economic Journal, 107(445), pp. 1848–1858.
Ng, Y. K. (1996) ‘Happiness surveys: Some comparability issues and an exploratory survey based on just perceivable increments’, Social Indicators Research. Springer Netherlands, pp. 1–27. doi: 10.1007/BF00293784.
Ng, Y. K. (2008) ‘Happiness studies: Ways to improve comparability and some public policy implications’, Economic Record. John Wiley & Sons, Ltd (10.1111), 84(265), pp. 253–266. doi: 10.1111/j.1475-4932.2008.00466.x.
Nozick, R. (1974) Anarchy, state, and utopia. New York: Basic Books.
Nussbaum, M. C. (2012) ‘Who is the happy warrior? Philosophy, happiness research, and public policy’, International Review of Economics. Springer-Verlag, 59(4), pp. 335–361. doi: 10.1007/s12232-012-0168-7.
OECD (2013) Guidelines on Measuring Subjective Well-being. OECD Publishing. doi: 10.1787/9789264191655-en.
Oswald, A. J. (2008) ‘On the curvature of the reporting function from objective reality to subjective feelings’, Economics Letters, 100(3), pp. 369–372. doi: 10.1016/j.econlet.2008.02.032.
Oswald, A. J. and Powdthavee, N. (2008) ‘Death, happiness, and the calculation of compensatory damages’, The Journal of Legal Studies, 37(S2), p. S251.
Ouweneel, P. and Veenhoven, R. (1991) ‘Cross-national differences in happiness: Cultural bias or societal quality?’, in Bleichrodt, N. and Drenth, P. (eds) Contemporary issues in cross-cultural psychology. Swets & Zeitlinger, pp. 168–184. Available at: https://psycnet.apa.org/record/1991-98357-012 (Accessed: 8 September 2021).
Perez-Truglia, R. (2012) ‘On the causes and consequences of hedonic adaptation’, Journal of Economic Psychology, 33(6), pp. 1182–1192. doi: 10.1016/j.joep.2012.08.004.
Plunkett, D. (2015) ‘Which Concepts Should We Use?: Metalinguistic Negotiations and The Methodology of Philosophy’, Inquiry (United Kingdom). Routledge, 58(7–8), pp. 828–874. doi: 10.1080/0020174X.2015.1080184.
Portugal, R. D. and Svaiter, B. F. (2011) ‘Weber-Fechner law and the optimality of the logarithmic scale’, Minds and Machines. Springer, 21(1), pp. 73–81. doi: 10.1007/s11023-010-9221-z.
van Praag, B. M. S. (1991) ‘Ordinal and cardinal utility. An integration of the two dimensions of the welfare concept’, Journal of Econometrics. North-Holland, 50(1–2), pp. 69–89. doi: 10.1016/0304-4076(91)90090-Z.
van Praag, B. M. S. (1993) ‘The Relativity of the Welfare Concept’, in The Quality of Life. Oxford University Press, pp. 362–385. doi: 10.1093/0198287976.003.0027.
Prati, A. and Senik, C. (2020) Feeling good or feeling better?, Working Papers. 13166. HAL.
Robbins, L. (1932) An essay on the nature and significance of economic science,. London: Macmillan. Available at: http://www.worldcat.org/title/essay-on-the-nature-significance-of-economic-science/oclc/838285 (Accessed: 21 April 2017).
Schelling, T. C. . (1960) The strategy of conflict. Massachusetts: Harvard University Press.
Schimmack, U. and Oishi, S. (2005) ‘The influence of chronically and temporarily accessible information on life satisfaction judgments’, Journal of Personality and Social Psychology, 89(3), pp. 395–406. doi: 10.1037/0022-3514.89.3.395.
Schneider, S. and Stone, A. A. (2016) ‘The meaning of vaguely quantified frequency response options on a quality of life scale depends on respondents’ medical status and age’, Quality of Life Research. Springer International Publishing, 25(10), pp. 2511–2521. doi: 10.1007/s11136-016-1293-7.
Schwarz, N. (1995) ‘What Respondents Learn from Questionnaires: The Survey Interview and the Logic of Conversation’, International Statistical Review / Revue Internationale de Statistique, 63(2), p. 153. doi: 10.2307/1403610.
Schwarz, N. and Strack, F. (1999) ‘Reports of subjective well-being: Judgmental processes and their methodological implications’, Well-being: The foundations of hedonic psychology, 7, pp. 61–84.
Sen, A. (1987) On Ethics and Economics. Oxford.
Smith, C. (2013) Making Happiness Count: Four Myths about Subjective Measures of Well-Being.
Steffel, M. and Oppenheimer, D. M. (2009) ‘Happy by what standard? The role of interpersonal and intrapersonal comparisons in ratings of happiness’, Social Indicators Research. Springer, 92(1), pp. 69–79. doi: 10.1007/s11205-008-9289-5.
Stevens, S. (1946) ‘On the Theory of Scales of Measurement’, Science, 103, pp. 677–680. Available at: https://www.jstor.org/stable/1671815 (Accessed: 21 July 2021).
Stone, A. and Krueger, A. (2018) ‘Understanding subjective well-being’, in Stiglitz, J. E., Fitoussi, J.-P., and Durand, M. (eds) For Good Measure: Advancing Research on Well-being Metrics Beyond GDP. OECD. OECD. doi: 10.1787/9789264307278-en.
Talbott, W. (2016) ‘Bayesian Epistemology’, Stanford Encyclopedia of Philosophy. Winter. Edited by E. Zalta. Available at: https://plato.stanford.edu/entries/epistemology-bayesian/ (Accessed: 24 June 2020).
Udayashankar, C., Oudeacoumar, P. and Nath, A. (2012) ‘Congenital insensitivity to pain and anhidrosis: A case report from South India’, Indian Journal of Dermatology. Wolters Kluwer — Medknow Publications, 57(6), p. 503. doi: 10.4103/0019-5154.103080.
Williamson, T. (2017) ‘Semantic paradoxes and abductive methodology’, in Armour-Garb, B. (ed.) Reflections on the Liar. Oxford: OUP, pp. 325–346. doi: 10.1093/oso/9780199896042.003.0013.
Wilson, T. D. and Gilbert, D. T. (2005) ‘Affective Forecasting’, Current Directions in Psychological Science. SAGE PublicationsSage CA: Los Angeles, CA, 14(3), pp. 131–134. doi: 10.1111/j.0963-7214.2005.00355.x.
Wittgenstein, L. (1953) Philosophical investigations. Edited by G. Anscombe and R. Rhees. Oxford: Blackwell.
YouGov (2018) How good is “good”?
Available at: https://today.yougov.com/topics/lifestyle/articles-reports/2018/10/11/how-good-good (Accessed: 16 June 2021).