What are the Top 10 happiest countries in 2026?
Our friends at the World Happiness Report have just published their 2026 rankings, based on self-reported wellbeing. Read on to learn more.
Once again, the Nordic countries claim the top spots, with Finland retaining its title as the world’s happiest country. These wealthy, homogenous, high-trust states with generous welfare systems continue to dominate the rankings (we assume it doesn’t have to do with the pickled fish).
They are joined, however, by Costa Rica, which reaches 4th, the highest rank ever attained by a Latin American country.
The UK and United States may be countries that pride themselves on their exceptionalism, but they are not exceptionally high in wellbeing – barely making the Top 30.

Note. This is our own figure, based on data presented in the 2026 World Happiness Report. The happiness levels are an average of the years 2023, 2024, and 2025. The error bars are 95% confidence intervals.
Our favorite lessons from the 2026 World Happiness Report
Adolescent and young adult wellbeing has dropped off a cliff amongst anglophone countries (see Chapter 2).

Source: Table 2.2, World Happiness Report 2025. ***p < 0.001. Estimates use Gallup’s post-stratification survey weights, normalised so that each country-year contributes equally. Survey-weighted standard errors. Baseline: 2006–2011; Recent: 2020–2025. The first survey wave was split between 2005 and 2006. N (baseline / recent): NANZ 2,216 / 1,968; W. Europe 9,428 / 8,807; UK/Ireland 1,330 / 800; Latin America 26,139 / 18,808.
Does higher social media use explain national declines?
In the Gallup data the higher rate of social media use in the USA only seems to explain a small difference between the USA and UK (Chapter 2).

Is social media related to lower wellbeing?
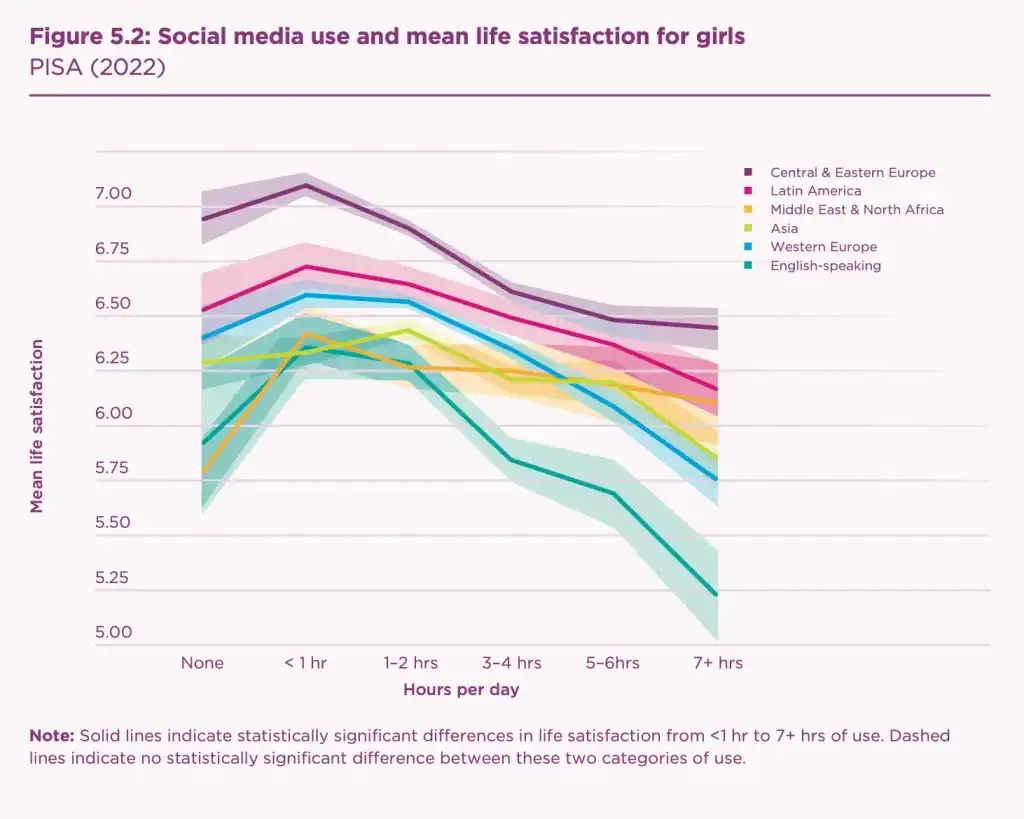
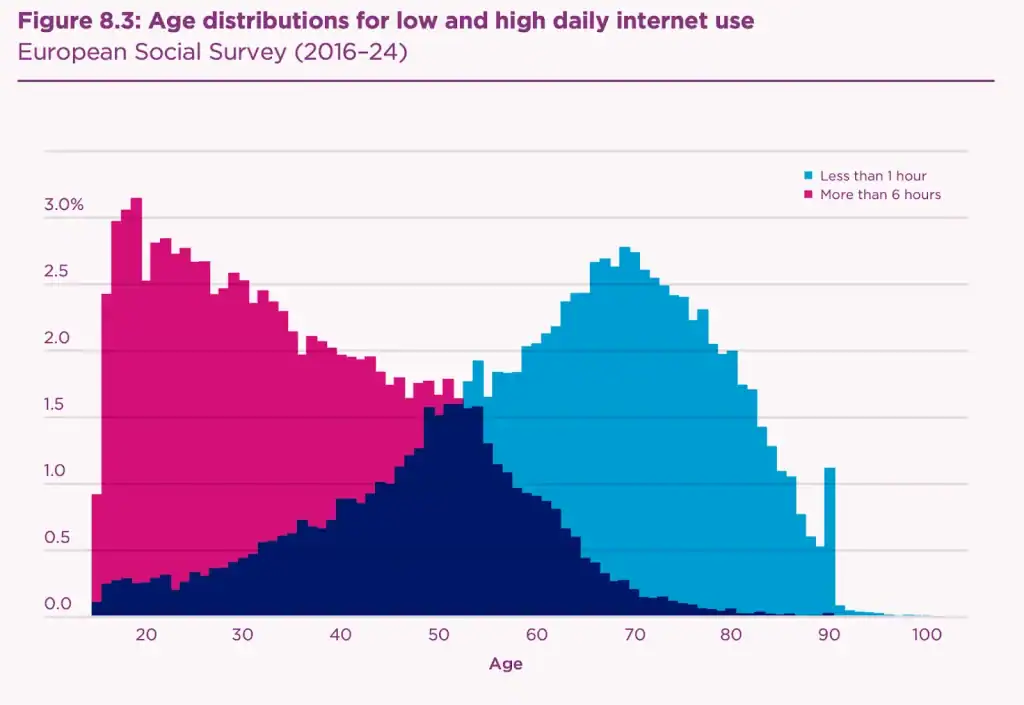
At high levels of use, it’s particularly related to lower wellbeing for young girls and women. The clearest correlational evidence is presented in Chapter 5, which shows strong differences between less than 1 hour and 7 or more hours of social media use per day across regions.
But does social media cause lower wellbeing?
Most of the evidence discussed in the World Happiness Report is either correlational or is related to internet usage more broadly (see Chapter 8). The exception is in Chapter 3 where leading social media critics (and authors of The Anxious Generation) Jonathan Haidt and Zachary Rausch discuss existing meta-analyses of experiments where people stopped using social media. The evidence from these is inconsistent, with the Haidt-Rausch interpretation being that if you look at the right outcomes (depression and anxiety) and the right time scales (getting off social media for 2+) weeks then you see consistent large effects.
We disagree with this interpretation for one clear reason: we think all mental wellbeing outcomes are comparably informative. So while this leads them to reject some results, we’d have to consider (Lemahieu et al. 2024), the experimental evidence seems to lean towards spending less time on social media being good – but the existing experimental evidence isn’t conclusive.
But bickering about these RCTs is a bit besides the point, because it’s unclear whether experiments that induce abstinence accurately reflect the effects of social media. The problem with abstinence is even if it showed no (or even a negative) effect – that doesn’t mean social media is good. That’s because one of the reasons many attest to being on it (and see point 6 below) is to avoid missing out. If you’re the only one that goes off, then that doesn’t seem to promise a good time. So are there any studies that study the effects of social media?
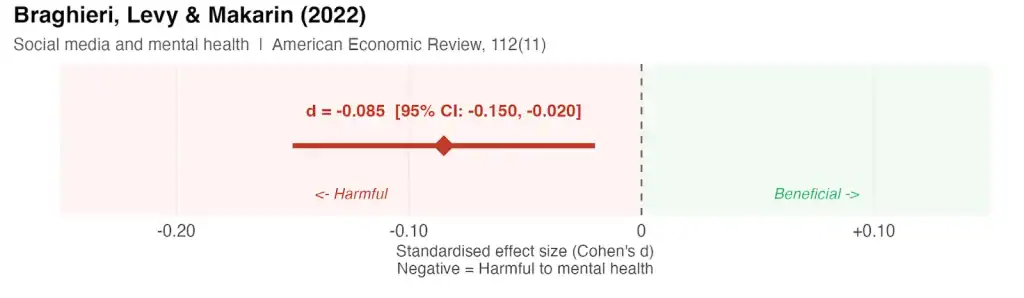
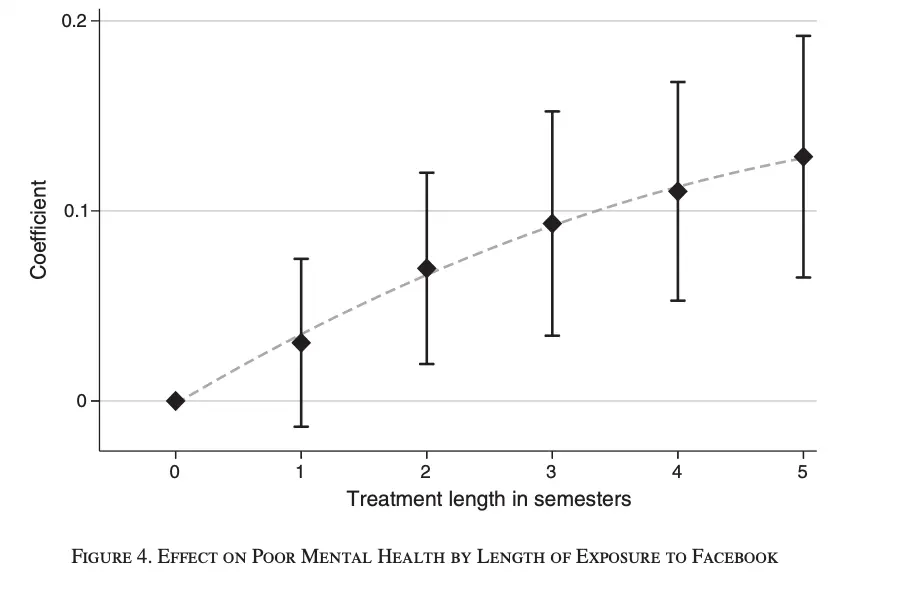
We know of a single study that actually estimates the causal impact of exposure to social media, Braghieri et al. (2022), and it finds substantial effects (-0.09 SDs) from the initial rollout of facebook on college students’ mental health (regardless of gender) and argue “mechanisms suggests the results are due to Facebook fostering unfavorable social comparisons.” While many scholars will sniff at an effect size of -0.09 SDs as trivial – this is the effect we found for cash transfers to people living in extreme poverty (McGuire et al., 2022). And apply these effects to the millions (billions?) of young people who use social media and you’ve got potentially, a pretty large source of harm.
And this was about the effects 20 years ago, before it became algorithmic and underwent years of engineering to maximize engagement. In our mind, this is the single strongest study to make the case against social media.
Social media’s associations are moderated by gender (chapter 5).
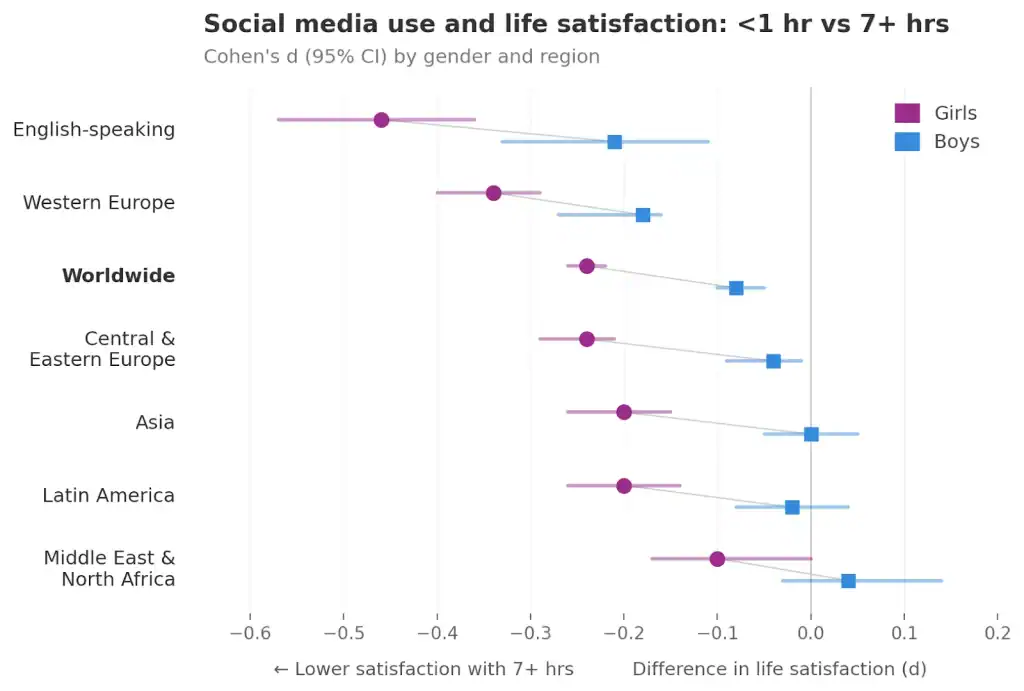
Source: Table 5.2, World Happiness Report 2025. Numbers are mean, standard deviation (in parentheses), and percent in each usage category. d = difference in standard deviations. 95% confidence intervals that do not include zero are statistically significant and shown in bold. N: Girls 144,346; Boys 141,612.
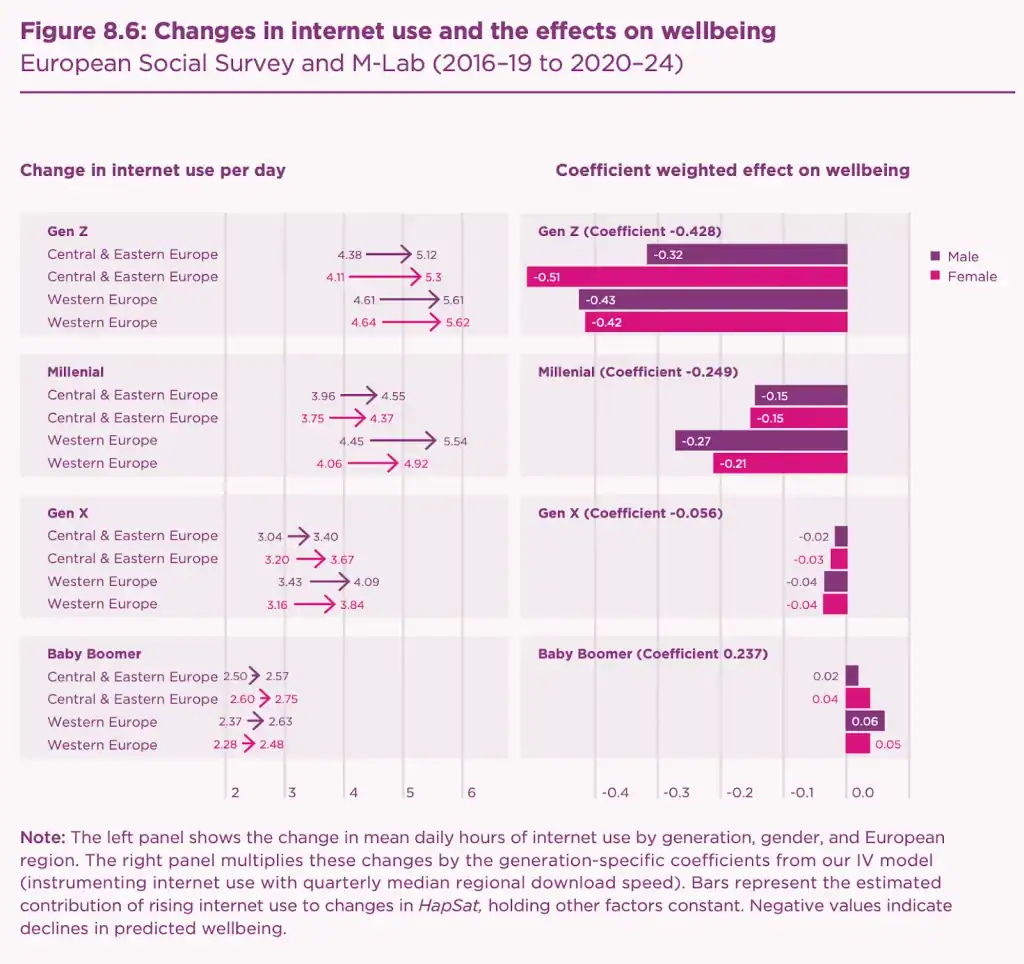
The effect of exposure to the internet (as a proxy for social media) varies dramatically by age (chapter 8).
Social media poses a collective action problem.
In chapter 6, Cass Sunstein reflects on the idea that social media might be a product trap, “in which they buy goods for whose abolition they would also be willing to pay.”
The key piece of evidence he cites is a study (as of yet unreplicated) that found:
“participants would be willing to pay $28 to have all members of their community (the relevant academic institution), including themselves, deactivate from TikTok for a month, and $10 to do the same for Instagram.17 Almost two-thirds of the active TikTok users appear to lose welfare from the existence of the platform. The same is true for almost half of the active Instagram users. They wish that everyone in their community were off the platforms. The central finding is that many people would demand significant money to stop using a product that they wish did not exist.”
Top happiest countries 2026 ranking
| Rank | Country | Score |
|---|---|---|
| 1 | Finland | 7.764 |
| 2 | Iceland | 7.540 |
| 3 | Denmark | 7.539 |
| 4 | Costa Rica | 7.439 |
| 5 | Sweden | 7.255 |
| 6 | Norway | 7.242 |
| 7 | Netherlands | 7.223 |
| 8 | Israel | 7.187 |
| 9 | Luxembourg | 7.063 |
| 10 | Switzerland | 7.018 |
| 11 | New Zealand | 6.995 |
| 12 | Mexico | 6.972 |
| 13 | Ireland | 6.928 |
| 14 | Belgium | 6.926 |
| 15 | Australia | 6.916 |
| 16 | Kosovo | 6.910 |
| 17 | Germany | 6.882 |
| 18 | Slovenia | 6.868 |
| 19 | Austria | 6.845 |
| 20 | Czechia | 6.821 |
| 21 | United Arab Emirates | 6.821 |
| 22 | Saudi Arabia | 6.817 |
| 23 | United States | 6.816 |
| 24 | Poland | 6.768 |
| 25 | Canada | 6.741 |
| 26 | Taiwan | 6.714 |
| 27 | Belize | 6.711 |
| 28 | Lithuania | 6.704 |
| 29 | United Kingdom | 6.694 |
| 30 | Serbia | 6.691 |
| 31 | Uruguay | 6.635 |
| 32 | Brazil | 6.634 |
| 33 | Kazakhstan | 6.633 |
| 34 | Romania | 6.629 |
| 35 | France | 6.586 |
| 36 | Singapore | 6.585 |
| 37 | El Salvador | 6.578 |
| 38 | Italy | 6.574 |
| 39 | Panama | 6.547 |
| 40 | Kuwait | 6.543 |
| 41 | Spain | 6.540 |
| 42 | Guatemala | 6.533 |
| 43 | Malta | 6.436 |
| 44 | Argentina | 6.430 |
| 45 | Vietnam | 6.428 |
| 46 | Estonia | 6.410 |
| 47 | Bosnia and Herzegovina | 6.381 |
| 48 | Latvia | 6.365 |
| 49 | Jamaica | 6.305 |
| 50 | Chile | 6.302 |
| 51 | Nicaragua | 6.301 |
| 52 | Thailand | 6.296 |
| 53 | Uzbekistan | 6.283 |
| 54 | Slovakia | 6.255 |
| 55 | Bahrain | 6.254 |
| 56 | Philippines | 6.206 |
| 57 | Paraguay | 6.198 |
| 58 | Oman | 6.197 |
| 59 | Ecuador | 6.144 |
| 60 | Montenegro | 6.139 |
| 61 | Japan | 6.130 |
| 62 | Cyprus | 6.126 |
| 63 | Honduras | 6.096 |
| 64 | Dominican Republic | 6.093 |
| 65 | China | 6.074 |
| 66 | Kyrgyzstan | 6.049 |
| 67 | South Korea | 6.040 |
| 68 | Colombia | 6.040 |
| 69 | Portugal | 6.029 |
| 70 | Croatia | 6.009 |
| 71 | Malaysia | 6.005 |
| 72 | Peru | 5.974 |
| 73 | Mauritius | 5.939 |
| 74 | Hungary | 5.937 |
| 75 | Mongolia | 5.936 |
| 76 | Trinidad and Tobago | 5.905 |
| 77 | Moldova | 5.851 |
| 78 | Bolivia | 5.835 |
| 79 | Russia | 5.834 |
| 80 | Venezuela | 5.756 |
| 81 | Libya | 5.731 |
| 82 | North Macedonia | 5.719 |
| 83 | Algeria | 5.714 |
| 84 | Bulgaria | 5.703 |
| 85 | Greece | 5.697 |
| 86 | Albania | 5.662 |
| 87 | Indonesia | 5.617 |
| 88 | Tajikistan | 5.591 |
| 89 | Armenia | 5.584 |
| 90 | Hong Kong | 5.569 |
| 91 | Georgia | 5.517 |
| 92 | Laos | 5.515 |
| 93 | Mozambique | 5.336 |
| 94 | Turkey | 5.300 |
| 95 | Iraq | 5.212 |
| 96 | Gabon | 5.167 |
| 97 | Iran | 5.151 |
| 98 | Côte d'Ivoire | 5.148 |
| 99 | Nepal | 5.147 |
| 100 | Cameroon | 5.083 |
| 101 | South Africa | 5.009 |
| 102 | Azerbaijan | 4.993 |
| 103 | Niger | 4.940 |
| 104 | Pakistan | 4.868 |
| 105 | Tunisia | 4.798 |
| 106 | Nigeria | 4.788 |
| 107 | Senegal | 4.787 |
| 108 | Namibia | 4.781 |
| 109 | Palestine | 4.694 |
| 110 | Kenya | 4.674 |
| 111 | Ukraine | 4.658 |
| 112 | Morocco | 4.646 |
| 113 | Guinea | 4.609 |
| 114 | Mali | 4.588 |
| 115 | Ghana | 4.554 |
| 116 | India | 4.536 |
| 117 | Somalia | 4.508 |
| 118 | Uganda | 4.491 |
| 119 | Jordan | 4.478 |
| 120 | Mauritania | 4.473 |
| 121 | Cambodia | 4.462 |
| 122 | Congo | 4.456 |
| 123 | Burkina Faso | 4.455 |
| 124 | Benin | 4.393 |
| 125 | Chad | 4.385 |
| 126 | Lesotho | 4.375 |
| 127 | Bangladesh | 4.319 |
| 128 | Gambia | 4.306 |
| 129 | Myanmar | 4.287 |
| 130 | Liberia | 4.280 |
| 131 | Togo | 4.277 |
| 132 | Madagascar | 4.174 |
| 133 | Zambia | 4.106 |
| 134 | Sri Lanka | 4.013 |
| 135 | Ethiopia | 3.985 |
| 136 | Comoros | 3.925 |
| 137 | Eswatini | 3.909 |
| 138 | Tanzania | 3.902 |
| 139 | Egypt | 3.862 |
| 140 | Democratic Republic of the Congo | 3.761 |
| 141 | Lebanon | 3.723 |
| 142 | Yemen | 3.532 |
| 143 | Botswana | 3.464 |
| 144 | Zimbabwe | 3.346 |
| 145 | Malawi | 3.284 |
| 146 | Sierra Leone | 3.251 |
| 147 | Afghanistan | 1.446 |