
Summary
Mass deworming, where many people are provided drugs to treat parasitic worms, has long been considered a highly cost-effective intervention to improve lives in low-income countries. GiveWell directed over $163 million to deworming charities since 2010. Nevertheless, there are long-running debates about its impact and cost-effectiveness. In this report, we summarise the debate about the efficacy of deworming, present the first analysis of deworming in terms of subjective wellbeing (SWB), and compare the cost-effectiveness of deworming to StrongMinds (our current top recommended charity).
Analysing SWB data from the Kenyan Life Panel Survey (KLPS; Hamory et al., 2021), we find that deworming has a small, statistically non-significant effect on long-term happiness that seems (surprisingly) to become negative over time (see Figure 1). We conclude that the effect of deworming in the KLPS is either non-existent or too small to estimate with certainty. Typically, an academic analysis could stop here and not recommend deworming. However, the non-significant effects of deworming could be cost-effective in practice because it is extremely cheap to deliver. Because the effect of deworming is small and becomes negative over time, our best guess finds that the overall cost-effectiveness of deworming is negative. Even under more generous assumptions (but still plausible according to this data), deworming is less cost-effective than StrongMinds. Therefore, we do not recommend any deworming charities at this time. To overturn this conclusion, proponents of deworming would either need to (1) appeal to different SWB data (we’re not aware of any) or (2) appeal to a non-SWB method of comparison which concludes that deworming is more cost-effective than StrongMinds.
Figure 1: Differences in happiness between treatment and control groups over time
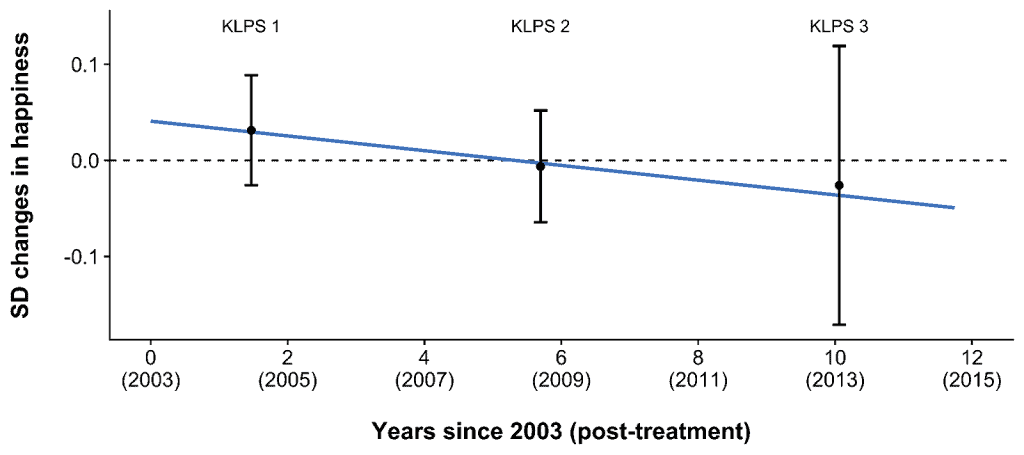
Note. The point estimates show the difference (in Cohen’s d) in happiness between the treatment and control group at each time point. The bars represent 95% confidence intervals. The regression line shows the trend of the difference between treatment and control over time.