A dozen doubts about GiveWell’s numbers
This essay was written for GiveWell’s Change Our Mind Contest 49
Summary
We raise twelve critiques of GiveWell’s cost-effectiveness analyses. Ten apply to specific inputs for malaria prevention, cash transfers, and deworming. Two are relevant for more than one intervention. Our calculations are available in this modified spreadsheet of GiveWell’s cost-effectiveness analyses 50. We provide a summary of these first, then set them out in greater detail. We encountered these as part of our work to replicate GiveWell’s analysis. They do not constitute an exhaustive review.
Malaria prevention
1. GiveWell assumes that a large fraction (34%) of the total effects of anti-malaria bed nets come from the extra income children will later earn due to reduced malaria exposure. However, GiveWell provides little explanation or justification for these numbers, which are strikingly, indeed suspiciously, large: taken at face value, they imply that bednets are 4x more cost-effective at increasing income than cash transfers.
We were unsure what the income-increasing effect of bednet should be, so we investigated a number of factors, which we enumerate as the next six critiques.
2. The evidence GiveWell uses to generate its income-improving figure for bednets is from contexts that seem very different from that of the charities it recommends. While GiveWell does discount this evidence it uses for ‘generalisability’, we suggest a larger discount would be consistent with GiveWell’s reasoning regarding deworming and would reduce the total cost-effectiveness by at least 10%.
3. We present possible mechanisms for malaria prevention to income benefits, but they do not explain most of the effects. It’s unclear how this would change the cost-effectiveness results.
4. We demonstrate how GiveWell’s analysis does not sufficiently adjust for differences in context by looking at malaria prevalence. Malaria prevalence was higher in the context of the evidence than in AMF’s context. When we adjust for this, we expect this will lead to around a 17% decrease in AMF’s total cost-effectiveness, with low confidence.
5. GiveWell has missed some evidence for the effect of malaria prevention on income. We expect this decreases the total cost-effectiveness of AMF by 14%, with moderate confidence.
6. GiveWell may underestimate the differences in benefits between women and men. We expect with moderate confidence that incorporating more evidence would decrease the total cost-effectiveness of AMF by 6% [note: this was previously 16%].
7. GiveWell assumes, without clear justification, that the income effects of malaria prevention will endure in just the same way as they suppose the effects of deworming do. We’ve previously called deworming’s benefits into question (McGuire et al., 2022), incorporating the adjustment proposed there would decrease the total cost-effectiveness by AMF by 3.4% to 10.2% (low confidence)
We’ve presented these changes in cost-effectiveness for changing only one variable at a time. If we implement all of them at once (excluding critiques 3 and 7 for which we are more uncertain how they’ll change the results), then the effects decline by 26% (see row 202 of “AMF total” tab).51
Cash transfers
8. GiveWell’s analysis of the effectiveness of cash transfers only uses one study to estimate GiveDirectly’s immediate increases in consumption (Haushofer & Shapiro, 2013) when there are many more available. Using more data we show that recipients of GiveDirectly cash transfers are actually 70% richer than assumed in GiveWell’s cost-effectiveness analysis. Hence, the relative increase in consumption from GiveDirectly cash transfers decreases from 0.35 to 0.22 log-units (i.e., a decrease of 27%, which leads to an overall 38% decrease in cost-effectiveness).
Deworming
9. GiveWell’s analysis relies on one long-term study from Kenya (the PSDP; Miguel & Kremer, 2004). We found another long-term study by Liu and Liu (2019), which was from China. We’re not sure how comparable these are but if we naively average the income effects, the cost-effectiveness of deworming goes up by 22%. If we add some adjustments based on context (although we have not fully considered these), then the effects of deworming decrease by 22%.
10. GiveWell subjectively applies a large 87% ‘replicability’ discount to deworming to (in part) account for the fact it relies on only one long-term study. Given there are now two studies, that indicates GiveWell could reduce the replicability discount by some fraction, which would increase the cost-effectiveness of deworming. If, for example, the replicability discount decreased to 80% (a total guess), then the effects of deworming would increase by 21%.
Criticisms about country-level analyses
GiveWell split their cost-effectiveness analyses at the country level. However, they fail to consider the granularity across two important factors at the country level that might change the cost-effectiveness of the charities:
11. Granularity about the age at which recipients would have died from a cause and how this relates to GiveWell’s moral weights.
12. Household sizes differ across countries which would affect the calculation of household spillovers.
General methodology
Unless specified otherwise, we follow the same process in each of our critiques for quantifying how a change in an input in GiveWell’s analysis alters the overall cost-effectiveness estimate. First, we identify a value that we think should be changed. Then, we plug this into our copy of GiveWell’s cost-effectiveness spreadsheet and report how great a change (in percentage) this causes to the overall (average) cost-effectiveness of the charity. GiveWell’s models are complicated, so we are not always able to explain why a tweak to a model changes the results.
Malaria prevention
GiveWell’s malaria prevention CEA considers two sources for the value of malaria prevention: (1) saving lives by preventing malaria deaths, and (2) increasing later consumption by preventing children from suffering from malaria. In their malaria prevention analysis, they estimate that increases in income stemming from malaria prevention comprise 34%52 (see row 141 of “AMF” tab) of the total value of malaria prevention. We investigated this part because some of the numbers looked suspicious; we haven’t closely examined or noticed problems with the numbers relating to the prevention of deaths.
1. Income effects of malaria prevention are surprisingly large yet mostly unexplained
GiveWell estimates that malaria prevention with bed nets is four times more cost-effective at improving economic outcomes than GiveDirectly cash transfers (see row 224, sheet “AMF”).53 This is a surprisingly large effect, as we assumed that cash transfers, given they aim to improve economic outcomes, would be more effective at doing so. What’s more, we expected that if GiveWell were aware of this result and sincerely believed it, they would strongly advocate that donors should fund bednets rather than cash transfers via a form dominance reasoning: not only are bed nets 4x better at reducing poverty, you also get to save lives ‘for free’.
However, this is not a result that GiveWell draws much attention to or explains. It is based on their estimates of how a year of malaria prevention increases lifelong economic outcomes by 2.3%. The most information GiveWell provides for the reasoning behind these figures is in a note (row 109, sheet “AMF”).
“This figure [2.3%] represents a midpoint between the findings of two natural experiments (Bleakley, 2010; Cutler et al., 2010).54 It should be interpreted as the expected increase in lifetime income from reducing the point in time probability of having malaria from 1 to 0 for one year.
We are uncertain at what age range children would get long term benefits from malaria reduction … We have not yet published the full rationale for choosing this figure.”
They first made this claim about malaria prevention’s effect on income in the 2018 version of their CEA (row 79, sheet “Nets”) and have not published their rationale since. We cannot detect any change in their analysis since then. While we cannot follow GiveWell’s full rationale, we suggest some problems with GiveWell’s present figures.
2. GiveWell’s generalisability discount for malaria prevention’s income effects is too small
An issue that GiveWell clearly recognises is that the evidence for the life-long income benefits comes from a very different context than the one the AMF works in and is thus tricky to generalise:
“They [Bleakley 2010; Cutler et al. 2010] study different malaria interventions that operated in different places and time periods and generated larger reductions in malaria prevalence than the programs we are currently modelling. While they support the idea that suffering from malaria can have substantial impacts on long-term income, we are unsure if extrapolating the effect sizes they estimate is externally valid for our model […] We therefore apply a subjective downward adjustment (70%) to the headline results of the studies.” (row 110, sheet “AMF”)
We agree with GiveWell’s uncertainty but think that adjusting the results by multiplying them by 0.7 (a 30% discount) seems insufficient and inconsistent with GiveWell’s other discounts. To explain why, let’s walk through the ways in which the context differs between the evidence and AMF.
The first difference between the evidence and AMF is that the natural experiments studied permanent malaria eradication through mass spraying of DDT55 – an infamous neurotoxin – in areas with a high prevalence of mosquitoes. This intervention is very different from the insecticide-treated bednets distributed by AMF.
Another uncertainty is whether it is appropriate to extrapolate the effects of malaria eradication (i.e., preventing exposure for the rest of one’s life) to malaria suppression (i.e. protection for a single year) which is what AMF does (explained in a footnote).56
The location and time period of the evidence also differs dramatically between the evidence and implementation contexts. The malaria eradication campaigns studied by Bleakley (2010) and Cutler et al. (2010) occurred in non-African countries in the early and middle part of the 20th century.
Implication
While GiveWell recognizes these differences we discussed above, they only discount the effects by 30%. We think this discount is oddly small, given that GiveWell, to adjust for the differences between the contexts of the deworming studies and charities, applies uses a 90% discount,57 even though the evidence-implementation gap for deworming appears less severe, as we illustrate in Table 1 below.
Table 1: Summary of the evidence to implementation gap for malaria prevention and deworming
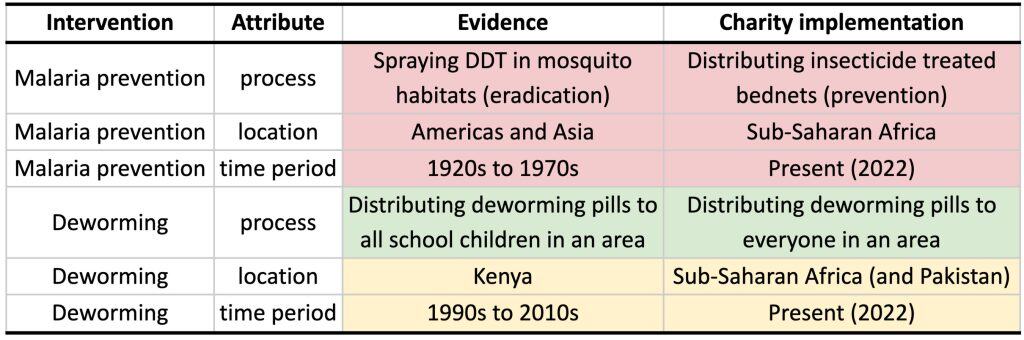
In GiveWell’s analysis of deworming, they extrapolate the causal effects of evidence from one context to a slightly different context. The evidence and implementation for deworming share an intervention (pills), a continent (Africa), and have a smaller gap in the time period. When it comes to malaria prevention, all of these factors differ, yet it receives a smaller discount. This makes us sceptical that the generalizability discount for this effect would remain at 30%. One precise reason for a larger discount is attempting to incorporate the differences in malaria prevalence between contexts. We turn to that in the next critique.
3. Malaria prevention’s income mechanism remains unclear
GiveWell does not explain or defend malaria prevention’s mechanism for increasing incomes like they attempt to do for deworming (GiveWell, 2020). We tried to evaluate the case for its causal mechanisms – what about keeping children from getting malaria increases their future incomes? We think that malaria prevention can plausibly increase future income. This is important because the generalisability of malaria prevention’s income evidence will strongly depend on the mechanism. Unfortunately, the details of the mechanisms are still unclear to us. We provide more details below.
We are inclined to believe that malaria eradication campaigns in the 20th century increased income for two reasons. First, the quasi-experimental studies we cited above appear to have been carefully performed and consistently find lasting changes to income: the effect of malaria prevention for a year ranges from 0.53% to 3.33% increases in adult income.58 The magnitude of these causal effects is roughly consistent with cross-sectional analyses comparing incomes in countries and regions with differences in malaria prevalence (Sarma et al., 2019).59 And at least one of the papers we cite, Bleakley (2010) has held up to replication (Roodman, 2018).
Second, whilst the general mechanism appears plausible, we are unsure about the detail. It’s an established finding that negative shocks to childhood can have permanent economic consequences (see Schanzenbach, 2018, for a discussion), so we think the general mechanism is through protecting a child’s development. The exact mechanism is unclear to us (we haven’t rigorously reviewed the literature), but seems to plausibly be through improvements to educational attainment,60 health, or cognitive function.61 There appears to be evidence supporting each of these mechanisms, but none seem to fully explain the results. Note that we only quickly reviewed this literature.
If – as appears to be one plausible pathway supported by the evidence – malaria prevention increased school attendance which then boosted incomes, then that may be less relevant for today’s malaria prevention actions because schooling is much more common everywhere – even in Africa (OWID, 2022). On the other hand, schooling may be much more necessary for the present and future labour markets. A similar challenge faces cognitive function as a pathway. IQ scores rose dramatically in the 20th century (OWID, 2022), so relative increases in cognitive function will be smaller, but a greater share of work may reward intelligence.
While we think the case that malaria eradication campaigns improved income is relatively sound, we are much less sure how well this predicts future malaria prevention efforts for reasons we’ve enumerated in critiques 1 and 2.
4. GiveWell omits relative prevalence adjustments between evidence and AMF
We now show that the discount might be closer to 64% if we adjust for differences in malaria prevalence (using fatality rates as a proxy), which would reduce the overall cost-effectiveness of malaria prevention by 17%. Prevalence is only one factor amongst many that differ between the evidence and charities’ interventions, so the discount is likely different from exactly 64%.
GiveWell mentions in a comment (see row 110 of the “AMF” tab) that the malaria income studies they use (Bleakley, 2010; Cutler et al., 2010) “study different malaria interventions that operated in different places and time periods and generated larger reductions in malaria prevalence than the programs we are currently modelling”.
As we highlighted above, it seems like previous attempts at malaria prevention led to more dramatic reductions in malaria prevalence than occur today. We can try to estimate some of these differences, such as the difference in prevalence between contexts. While we can’t find prevalence information across the countries studied, we use malaria fatality rates as a proxy to compare the study countries with countries where AMF currently operates.
In the countries where AMF operates, the average malaria fatality rate (if they don’t provide bednets) is 73 per 100,000 people (OWID, 2022). However, the average death rate in the pre-eradication era across the causal studies is 203.62 If death rates are a suitable proxy for prevalence, then we can expect that the countries AMF operates in to have about 73/203 = 36% of the level of malaria that was experienced in the areas from the evidence GiveWell relies on for the income estimates. If we adjust for this difference in prevalence, then the generalisability discount would increase from GiveWell’s subjective guess of 30% to 1 – 36% = 64%. Adding this adjustment, the income effect is nearly halved, reducing the overall cost-effectiveness of AMF by 17% (see row 202 of the “AMF t3” tab).63 One caveat to this is that there’s probably a good reason to mistrust malaria death rate as a proxy for prevalence – basic healthcare has obviously improved across the world in the past 70 years or so (OWID, 2022).
5. GiveWell’s malaria prevention analysis misses relevant data
As already stated, GiveWell estimates that long-term increases in income comprise 34% (see row 141 of “AMF” tab) of the value of malaria prevention. We found four studies of the income-increasing benefit of malaria prevention in addition to the two that GiveWell uses: (Shih & Lin, 2019; Rawlings, 2016; Mora-garcía, 2018; Venkataramani, 2012). These studies, like Bleakley (2010) and Cutler (2010), primarily focused on malaria eradication campaigns, and none are clearly more relevant in context to AMF. These studies show that the lifelong income benefits of malaria prevention are lower than estimated by GiveWell. Including this new information decreases the lifetime income effect from 2.3% to 1.4% (a 39% decrease), which, by itself, leads to a decline in the cost-effectiveness of the Against Malaria Foundation (AMF) by 14% (see row 200 of ‘AMF t1’) – which is about what we’d expect since GiveWell estimates that income benefits make up about a third of the total value of AMF (39% * 14% = 13%).
6. GiveWell may underestimate the sex differences in income benefits
The income effects GiveWell use only considers the effect on men. GiveWell notes that:
“The studies primarily report outcomes for males. We would guess that there would also be effects on income for females, but that these would be lower due to females having lower rates of labor force participation. We apply a further discount of 25% [i.e., multiplying the original figure by 0.75] to account for this consideration.” (see row 110 of ‘AMF’).
We take this to imply that GiveWell thinks that the effect on women’s income is 50% lower than that for men’s. If this is how GiveWell wants to implement it, then by using more data they could come to a more informed (and larger) discount.
We can estimate this with the four studies we found with regression specifications including a dummy variable representing sex. We can take the ratio of the male and female income effects and average them to get the average ratio of female-to-male income effects. The interpretation of this ratio is that, for example in Mora-Garcia (2018), the effect on women’s income is 62% smaller than what is for men.
Table 2: Ratio of female-to-male income effects
Study | Country | Ratio of male to female effects | Source |
| Shih & Lin, 2019 | Taiwan | -16.67%64 | model 3, table 5, p 15 |
| Mora-garcía, 2018 | Costa Rica | 61.95% | models 4 & 5, table 2, p 604 |
| Venkataramani, 2012 | Mexico | 37.07% | model 2, table 2, p 772 |
| Cutler et al., 2010 | India | 2.11% | model 3, table 3, p 85 |
Averaging these effects, we find that the effect on women’s income is only 21% of what it is for men (i.e., 79% lower).65 As this concerns half the population, this implies a 79/2 = 39% discount, which is larger than the 25% discount that GiveWell assumes and will lead to smaller effects. If we plug this into GiveWell’s CEA, this reduces the cost-effectiveness of AMF by 6% (see row 200 of ‘AMF t2’).
7. GiveWell assumes, without a clear rationale, that bed nets have the same long-term income effects as deworming
To account for how many years the income benefits of malaria prevention last, GiveWell appears to use the same model that they use for deworming. The most important component of this model is how long the benefits last and whether they decay.66 When estimating the duration of the benefits (40 years), they say “For consistency, we use the same figure here as we do for our deworming CEA.” (row 117, sheet “AMF”).
We have previously argued for an alternative modelling of deworming’s long-term benefits (McGuire et al., 2022) that GiveWell has said that, if incorporated, “will reduce our estimate of the cost-effectiveness of deworming by 10%-30%.” (GiveWell, 2022). The income benefits make up 34% (see row 141 of “AMF” tab) of the benefit of malaria prevention whilst almost all of the benefits of deworming come from income gains.67 So naively, we can predict that if GiveWell incorporated our previous critique of deworming’s decay, then the cost-effectiveness of AMF would drop by between 10% * 0.34 = 3.4% and 30% * 3.4 = 10.2%.
Cash transfers
8. GiveWell misses evidence for transfer recipients’ baseline consumption
GiveWell only uses one study to calculate the effect of GiveDirectly cash transfers on recipients’ consumption. Adding other relevant studies leads to the conclusion that GD’s recipients are 70% richer than GW assumes, which reduces the cost-effectiveness of GiveDirectly by 38%.
GiveWell estimates that 88% of GiveDirectly’s benefits come from gains to consumption (see row 130, sheet “GD”). The rest of the benefit is taken to be from effects on health, mortality, and child development (see rows 119 to 121, sheet “GD”). GiveWell distinguishes between consuming the cash now or later (saving and investment). They estimate that 39% of GiveDirectly cash transfers are saved and invested (row 12, sheet “GD”), and this represents 42% of the total value to consumption (because investments generate returns). GiveWell estimates that the remaining 58% of the cash transfers’ consumption benefits (see row 81 of the ‘GD’ tab) come from increasing present consumption.68 They estimate that immediate consumption increases by around 37% (see row 20).
To work out the 37% increase figure, GiveWell goes through several steps. First, GiveWell takes the baseline monthly consumption of the control group in purchasing power parity adjusted (i.e., PPP, see IMF, 2022 for an explanation) US dollars ($24), annualizes this to $286, and estimates how much per person income would increase if the non-invested portion of a $1,000 cash transfer was evenly divided amongst 4.7 household members. However, this $286 figure has two problems. First, it is not based on the difference between the control group and the treatment group, despite there being some available because of the RCTs of GiveDirectly cash transfers.69 You don’t need to run an RCT to acquire the information GiveWell uses.
Second, it is only based on the 2013 version (see row 19, sheet “GD”) of Haushofer and Shapiro’s (2016) study of GiveDirectly cash transfers. There are many other RCTs that study GiveDirectly cash transfers, most of which are conveniently summarised on GiveDirectly’s website. We collected the average annual consumption data from a convenience sample of other GiveDirectly RCTs (Haushofer & Shapiro, 2016; Haushofer et al, 2020; Egger et al, 2020; Banerjee et al., 2020; McIntosh & Zeitlin, 2020; Cooke et al., 2019). We extracted the relevant data in the “GD consumption data” tab. The average per capita consumption figure from these samples is $485, which is much higher than the $286 estimated by Haushofer and Shapiro (2013) alone.
We are not surprised that additional evidence indicates that GiveDirectly’s recipients are richer for two reasons. First, Africa has become wealthier in the past decade by $657 PPP per capita (World Bank, 2022). Second, as GiveDirectly scales, it will naturally run out of the poorest recipients. The new, higher figure of baseline consumption means a $1,000 cash transfer increases consumption relatively less. Since relative income changes are how GiveWell assesses the value of consumption increases, this translates into GiveDirectly being less effective.
When we include the baseline consumption, the relative increase in consumption decreases from 0.35 to 0.22 log-units (row 20) a decrease of 27%. Consequently, the effectiveness of GiveDirectly drops by 38% (see row 89, column d of the “GD” tab). But we are confused why the resulting overall cost-effectiveness changes by more than the benefits (-27% versus -38%).
GiveWell uses GiveDirectly as its baseline for cost-effectiveness analyses and will recommend charities that are 8 to 10 times more cost-effective than GiveDirectly (it has varied between 8 and 10 over the years). If GiveDirectly’s cost-effectiveness goes down, this implies that, relative to it, other things are now comparatively more cost-effective, which makes it easier for other things to clear GiveWell’s ‘bar’.
Deworming
9. Another study of deworming’s effect on income
GiveWell’s deworming analysis notably relies solely on evidence related to the Primary School Deworming Project (PSDP) studied by Miguel and Kremer (2004) and its follow-ups (Baird et al., 2016; Hamory et al., 2021). We found an additional study that estimates the long-term causal effects of childhood deworming on income (Liu & Liu, 2019) and seems to find slightly larger effects of deworming on income.
At first glance, this should increase GiveWell’s model of the cost-effectiveness of deworming. However, we want to strongly caveat this because (1) we have not had time to explore this new study in-depth, and (2) this new study is from a different context to that of the PSDP, so it is unclear how generalizable the effects are (cf the issues mentioned in our critique of Malaria above). Liu and Liu (2019) happened in a different country and continent (China, Asia vs. Kenya, Africa), happened at a different time (late 1950s rather than late 1990s-2000s), occurred in a context with different worm burdens, and had a different goal (eradication of schistosomiasis rather than control of schistosomiasis burden). There are likely other differences in the details of the deworming programs being compared. For instance, the average of respondents in Liu and Liu (2019) is in their 50s, while the eldest respondents in the PDSP are in their 30s.
For GiveWell (2018), the main impact of deworming is the long-term income benefits for children receiving deworming medication, calculated in relative economic gains (how much more the treatment group earns compared to the control group).70 In their calculations, they average the summary data about relative earnings and relative consumption gains for the treatment group and find that deworming leads to economic gains of 0.109 natural logs (or an 11.5% increase).
Liu and Liu (2019) estimate the causal effects of a schistosomiasis eradication campaign in China on life-long income by exploiting quasi-random differences in worm burden prevalence in worm burden across regions and reductions in burden across cohorts. The campaign started in 1957, and the survey they used was from 2010, allowing them to capture the effects of childhood deworming on the incomes of adults who are at the end of their careers. The main finding is:
If a county that had a 10 percent pre-control infection rate eradicated schistosomiasis, men (women) could earn […] about a 10 percent (40 percent) increase in personal income […] In terms of pure consumption, the effect equals […] an 8.8 percent increase in consumption per capita.
We compared and combined these results with GiveWell’s calculations for the PSDP. If we average across the genders, the earnings increase is (10 + 40) / 2 = 25%. If we average this with the consumption gains – as GiveWell does in their calculations – then the economic gains are (25 + 8.8) / 2 = 17%, or ln(1.17) = 0.16 natural logs. This is higher than GiveWell’s calculation for the PSDP’s treatment effect. When we average the two together, we get (0.11 + 0.16) / 2 = 0.133 natural logs. If we plug this into the calculation spreadsheet, we find that it increases deworming’s total cost-effectiveness by 22% (see row 222 of “DW t1”).71
Additionally, the 10% worm burden reduction (going from 10% to 0%) cited in Liu and Liu (2019) is lower than the 25% worm burden reduction that occurred in the PSDP (Miguel & Kremer, 2004). Naively, to correct for differences in worm burden, we adjust the Liu and Liu effect upwards by 25/10 = 2.5 to get 0.156 * 2.5 = 0.39. Additionally, the income effect in the PSDP is due to 2.41 years of deworming, whereas Liu and Liu (2019) looked at eradication, which would be a much larger dose. We do not know exactly what dosage this would involve, but if we follow GiveWell’s logic about the lifelong economic benefits of malaria (see our malaria critiques), then we would conclude that all the effects are concentrated in the first 15 years of life. On this assumption, 2.41 years of treatment for the Liu and Liu (2019) study would lead to an economic benefit of 0.39/(15/2.41) = 0.06. If we average the two together, we get (0.109 + 0.06) / 2 = 0.09 natural logs (which is lower than the naive average). If we plug this into the calculation spreadsheet, we find that it reduces deworming’s cost-effectiveness by 22% (see row 222 of “DW t2”). In the next section, we consider how adjusting the replicability adjustment increases the cost-effectiveness of deworming.
However, as aforementioned, this is only one of the differences in context, and we wouldn’t be surprised if other factors play different roles (large or small, negative or positive). We are unsure as to how well the results of Liu and Liu (2019) generalise to the context of GiveWell’s charities and the PSDP study.
10. Deworming’s replicability adjustment
An important part of GiveWell’s modelling of deworming is their ‘replicability adjustment’ (see row 11 of “DW”; discussion between HLI and GiveWell in McGuire et al., 2022). GiveWell has a prior belief that the effects of deworming are lower than what the PSDP study suggests, and the PSDP findings are uncertain and only from one study, so they adjust the results down towards their prior. Given that another study finds similar results for deworming, we think it is reasonable to reduce the replicability discount by some amount. We are unsure how much it would be reasonable to decrease this by. But even a relatively small change could make a large difference to the overall cost-effectiveness of deworming. For instance, if we decrease the replicability discount slightly from 87% to 80% (a complete guess) then this would increase the overall cost-effectiveness of deworming by 55% (row 220, sheet “DtW t2.5”). Combining this with the higher estimated economic benefit (see above) increases the cost-effectiveness of deworming by 21% (see row 222 of “DW t3”).
Criticism about country-level analyses
GiveWell applies their cost-effectiveness analyses to different countries in which the charities operate. By adding this level of analysis detail they can capture how the cost-effectiveness of charities varies across different countries. We think GiveWell’s analysis lacks granularity at the country level in two areas: (1) age of death and moral weights, and (2) household size and spillovers.
11. Age of death and moral weights
GiveWell attaches different values to saving lives at different ages (this is more complicated than simply that the youngest are most valuable; see GiveWell’s 2020, moral weights). However, in their analyses, they split the life-saving effects simply into under-5s and over-5s ‘buckets’; Hence, they treat saving the life of a six-year-old as the same as an eighty-six-year-old. This inconsistency matters for two important reasons.
First, because their moral weights relate to age in more detail than only the two categories of ‘under-5-year-olds’ and ‘over-5-year-olds’. See Figure 1 below for GiveWell’s distribution of moral weights across ages.
Figure 1: GiveWell’s disvalue of death at different ages in units of doubling consumption
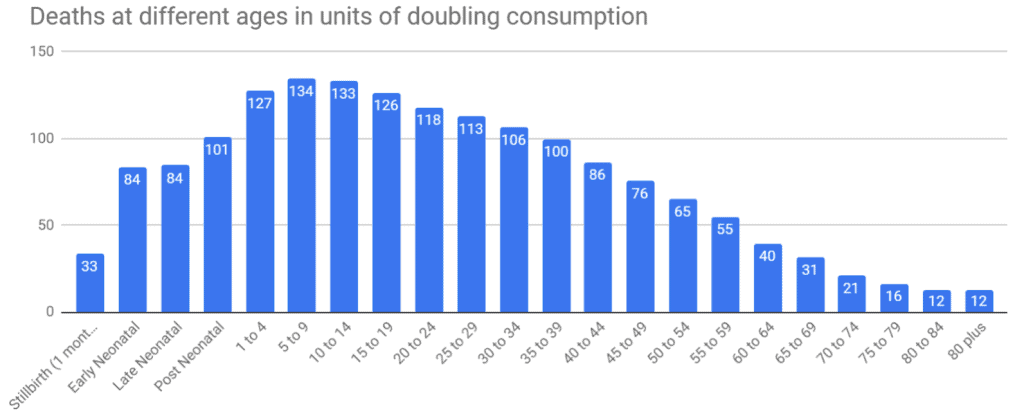
Note: This graph comes from GiveWell (2020). Plant (2022) discusses these weights in more depth.
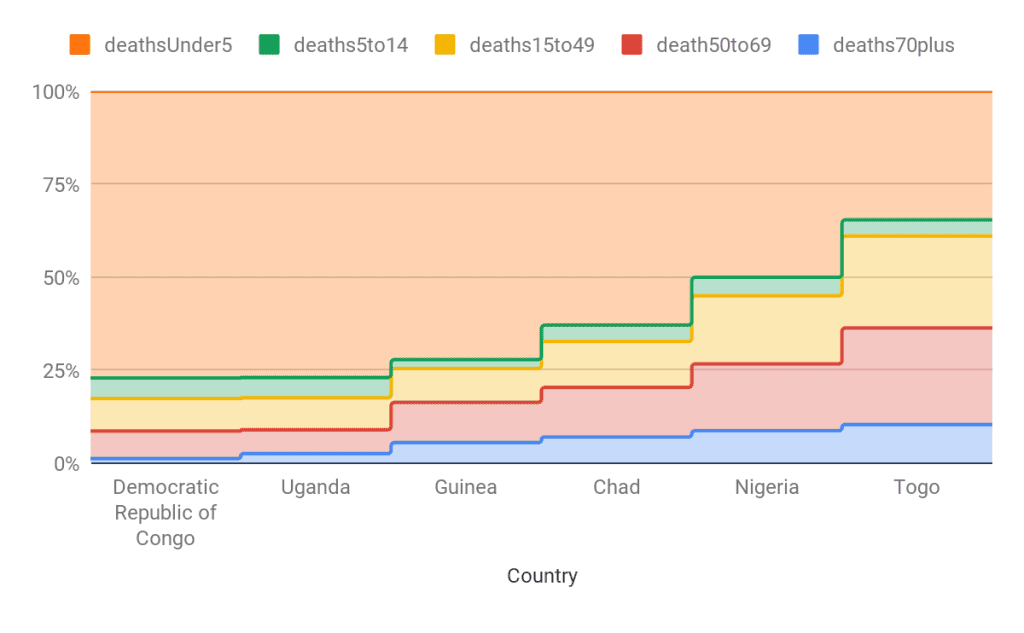
Second, the age composition of people who die from a certain cause shifts by country – and thus by charity – which could plausibly affect the cost-effectiveness of the charities. The age of people who die from malaria who are over 5 years old shifts considerably across countries (see Figure 2). This means the average disvalue of the death should shift too – but in GiveWell’s CEA, each over-5 saved is given the same value. We haven’t yet calculated how much difference this could make, but we guess country-specific cost-effectiveness figures could shift considerably.
Figure 2: The share of deaths from malaria per age for AMF countries
12. Household size and spillovers
Household spillovers are the benefits an intervention has on the members of the recipient’s household. For example, a cash transfer to an individual might benefit the rest of the household if the money is shared or if household goods are purchased. GiveWell’s household spillovers model lacks granularity across the interventions and the countries in which they operate.
For all non-cash transfer interventions that lead to economic benefits, GiveWell assigns a blanket 2x ‘household resource sharing’ multiplier.72 The model for this multiplier assumes a 4.5-person household that transitions to a 2-person household after 18 years. We suggest that GiveWell should update this model with country-specific household sizes; the data is easily accessible. As it stands, their current model overestimates the cost-effectiveness of interventions in areas where the average household is less than 4.5, and vice versa when the average household is over 4.5. For example, if we update Deworm the World’s Pakistan programme with the household multiplier that comes out of Pakistan having a household size of 6.8 (UN, 2019), this increases its cost-effectiveness by 47% (see row 220, “DtW t4” sheet). Note that Pakistan has an unusually large average household size, so this shift is an upper bound. We did not have time to explore how implementing this change would affect other country-charity cost-effectiveness combinations.
Conclusion
In this document, we demonstrated a range of critiques of GiveWell’s cost-effectiveness calculations that substantially alter the results. These were shallow explorations, so we expect the numbers to change with further scrutiny. That being said, we think that taken together, these critiques make a case that GiveWell should consider investing relatively more resources into updating their CEAs, reviewing its past research, and setting higher standards for future research that will guide the allocation of millions of dollars.
There are many areas of GiveWell’s analyses we have not reviewed. We did not review GiveWell’s analysis of vitamin-A supplementation, conditional cash transfers for vaccines, how they calculate costs, nor how they make their various other adjustments.