Response to GiveWell’s assessment of StrongMinds
November 2024: Update to our analysis
We have made a substantial update to our psychotherapy report. This 83 page report (+ appendix) details new methods as well as an updated cost-effectiveness analysis of StrongMinds and Friendship Bench. We now estimate StrongMinds to create 40 WELLBYs per $1,000 donated (or 5.3 times more cost-effective than GiveDirectly cash transfers). We now estimate Friendship Bench to create 49 WELLBYs per $1,000 donated (or 6.4 times more cost-effective than GiveDirectly cash transfers).
See our changelog for previous updates.
Context
On the 22nd of March 2023, GiveWell’s posted an “Assessment of Happier Lives Institute’s Cost-Effectiveness Analysis of StrongMinds”. Here, we present our responses. First, a general response from Michael. Second, a technical response from Joel. You can follow our discuss with GiveWell on the Effective Altruism Forum.
Michael’s general response
We are really pleased to see that GiveWell has engaged with the subjective wellbeing approach and has assessed our work at the Happier Lives Institute. There are a lot of complicated topics to cover, so we’ve split our response into two. I’m going to try to give a shorter, non-technical reply for those that want to know, in broad terms, what HLI’s response is. My colleague Joel will dive into all the details and provide more substance. It’s not quite a ‘good cop, bad cop’ routine, so much as a ‘simple cop, more-than-you-wanted-to-know cop’ routine. You have been warned…
Here’s my reply, in a large nutshell
- We’re very grateful to GiveWell for writing this and sending it to us a week in advance.
- We were pleasantly surprised to to see GiveWell evaluating charities using happiness data, and in terms of “Well-being Life-Years” aka WELLBYs. We are also encouraged that StrongMinds comes out as more cost-effective than cash transfers on their analysis.
- GiveWell’s analysis should be seen as a game of two halves. The first half is GiveWell reevaluating our cost-effectiveness of StrongMinds. The second half is comparing StrongMinds against the Against Malaria Foundation, a GiveWell top-charity.
- On the first half: GiveWell concludes the effect of StrongMinds is 83% smaller, but this figure is the result of the various researcher-made subjective discounts. We find that only 5% of the 83% discount is clearly supported by the evidence. This raises questions about the role and limits of subjective assessments.
- On the second half: GiveWell claims AMF, one of their top charities, is 4x more cost-effective than StrongMinds, but glosses over how comparing life-improving against life-saving interventions is very complex and heavily depends on your philosophical assumptions. GiveWell puts forward its analysis using only its own ‘house view, a view which is one of the most favourable to saving lives. On different, reasonable assumptions the life-improving option is better. We think these issues merited greater attention than GiveWell’s report provided – we hope GiveWell returns to them another time.
Here’s my reply, in more depth
1. I’m extremely grateful to Alex Cohen and GiveWell for writing this report, and generously sending it to us a week in advance so we could prepare a reply.
Readers may or may not know that I floated the ideas of (1) in general, using subjective wellbeing, or happiness, scores as a measure of impact and (2) more specifically, mental health interventions being unduly overlooked, now about 5 years ago (eg here and here). I’ve also directly raised these issues in meetings with GiveWell staff several times over that period and urged them to engage with (1) and (2) on the grounds they could substantially change our views on what the top giving opportunities are. This is GiveWell’s first substantial public response, and it’s really incredibly useful to be able to have the debate, see where we disagree, and try to move things forward. I’ve often been asked “but what do GiveWell think?” and not known what to say. But now I can point to this! So, thank you.
2. We were pleasantly surprised to to see GiveWell are evaluating charities using happiness data, and in terms of “Well-being Life-Years” aka WELLBYs. We are also encouraged that StrongMinds comes out as more cost-effective than cash transfers on their analysis.
We are delighted to see GiveWell using the subjective wellbeing approach. We’ve long advocated for it: we think we should ‘take happiness seriously’, use self-reports surveys, and measure impact in wellbeing life-years (‘WELLBYs’, see this write up or this talk for more detail). We see it much as Churchill saw democracy – it’s the worst option, apart from all the others. Ultimately, it’s the wellbeing approach we’re really excited about; despite what some have thought, we are not axiomatically committed to improving mental health specifically. If there are better ways to increase happiness (e.g. improving wealth or physical health, stopping wars, etc.), we would support those instead.
That said, we are surprised by the use of wellbeing data. In discussions over the years, GiveWell staff have been very sceptical about the subjective wellbeing approach. Alex doesn’t express that scepticism here and instead comments positively on the method. So we’re not sure why, or what extent, the organisation’s thinking has changed.
We also think it’s worth flagging that, even on GiveWell’s (more sceptical) evaluation of StrongMinds, it is still at least 2x better then cash transfers. Opinions will differ on whether StrongMinds should, simply because of that, count as a ‘top recommendation’, and we don’t want to get stuck into those debates. We do think it shows that mental health interventions merit more attention (especially for people who are most concerned with improving the quality of lives). We’re unsure how GiveWell thinks StrongMinds compares to deworming interventions: this isn’t mentioned in the report, even though GiveWell have previous argued that deworming is many times better than cash transfers.
3. GiveWell’s analysis should be seen as a game of two halves. The first half is GiveWell reevaluating our cost-effectiveness of StrongMinds. The second half is comparing StrongMinds against GiveWell’s top (life-saving) charities, such as the Against Malaria Foundation.
Almost all of GiveWell’s report is focused on the first half. Let me comment on these halves in turn.
4. On the first half: GiveWell concludes the effect of StrongMinds is 83% smaller, but this figure is the result of the various researcher-made subjective discounts. We find that only 5% of the 83% discount is clearly supported by the evidence. This raises questions about the role and limits of subjective assessments.
How does GiveWell reach a different conclusion from HLI about the cost-effectiveness of StrongMinds? As mentioned, I’ll deal in broad strokes here, whereas Joel gets into the details. What GiveWell does is look at the various parts of our CEA, reassess them, then apply a subjective discount based on the researcher’s judgement. For the most part, GiveWell concludes a reduction is appropriate, but they do recommend one increase related to the costs (we used a figure of $170 per treatment, whereas GiveWell uses $105; this seems reasonable to us and is based on StrongMinds’ data). At the end of this process, the good-done-per-treatment-provided figure for StrongMinds has gone down by 83% to 1.08 WELLBYs , compared to 10.5 WELLBYs, a pretty hefty haircut.
Should we be convinced by these adjustments? GiveWell makes 7 discounts but, for only 1 of these do we agree there is clear evidence indicating (1) that there should be a discount and (2) how big the discount should be. For instance, GiveWell discounts the effect of StrongMinds by 25% on the grounds that programmes are less effective when applied at scale. The basic idea seems fine, but it is not clear where the 25% figure comes from, or if it’s justified. In an additional case – and readers need not worry about the technicalities here – GiveWell applies a 20% discount because they reason that those with depression will have a smaller variance in life satisfaction scores; however, when we do a quick check of the evidence, we find those with depression have a larger variation in life satisfaction scores, so no discount is warranted. The rest of the analysis is similar. Ultimately, we conclude that of the 83% reduction, only 5% of that 83% is clearly supported by the evidence. We are unsympathetic to 35% because of differing intuitions, and 15% we think is not warranted by the evidence. And for the remaining 45%, we are sympathetic to their being a discount, but there’s no evidence provided to demonstrate the size of the adjustment is justified.
All this raises the question: to what extent should researchers make subjective adjustments to CEAs, and other empirical analyses? We detect something of a difference between how we and GiveWell think about this. In HLI, we seem more uncomfortable with deviating from the data than GiveWell does. We don’t know what the right balance is. Possibly we’re too stringent. But this is the sort of case that worries us about researcher-based discounts: although each of Alex’s adjustments are small, taken individually, they end up reducing the numbers by a factor of about 10, which seems large, and the analysis is driven (more?) by intuition than empirical evidence.
Overall, the GiveWell’s analysis provides a minor, immediate update to our CEA and additional motivation to look into various areas when we update our analysis this year.
5. On the second half: GiveWell claims AMF, one of their top charities, is 4x more cost-effective than StrongMinds, but glosses over how comparing life-improving against life-saving interventions is very complex and heavily depends on your philosophical assumptions. GiveWell puts forward its analysis using only its own ‘house view’, one of the most favourable to saving lives. On different, reasonable assumptions the life-improving option is better. We think these issues merited greater attention than GiveWell’s report provided – we hope GiveWell returns to them another time.
How do GiveWell compare the cost-effectiveness of StrongMinds against their top charities? The top charity they mention in the post in the Against Malaria Foundation. Hence, GiveWell needs to also put WELLBY numbers on AMF. How do they do that? Importantly, AMF is a life-saving intervention, whereas StrongMinds is a life-improving intervention. This is more of an apples-to-oranges comparison. As we’ve recently argued, there isn’t “one best way” of doing this: the ‘output’ you get for this depends really heavily on the philosophical assumptions, or ‘inputs’, you make. Here’s part of the summary of our previous report:
We show how much cost-effectiveness changes by shifting from one extreme of (reasonable) opinion to the other. At one end, AMF is 1.3x better than StrongMinds. At the other, StrongMinds is 12x better than AMF. We do not advocate for any particular view. Our aim is simply to show that these philosophical choices are decision-relevant and merit further discussion.
What GiveWell does is use the framework and the figures we set out in our previous report, then plug in their preferred assumptions on the two key issues (the ‘account of the badness of death’ and the ‘neutral point’). This leads them to reach the conclusion that, on their reduced numbers for StrongMinds, AMF is 4x more cost-effective than StrongMinds. What GiveWell doesn’t point out is that their preferred assumptions are amongst the most favourable to the life-saving side of the comparison, and there are other positions you could reasonably hold that would lead you to the conclusion that the life-improving intervention, StrongMinds, is more cost-effective. Regardless of whether you accept our original estimate of StrongMinds, or GiveWell’s new, lower estimate, your conclusion about which of StrongMinds or AMF is more cost-effective is still dependent on these philosophical choices, i.e. going from one extreme to the other still flips the results. Again, I’ll leave it to Joel to get into the specifics.
In some sense, the disagreement in the second half of the analysis is similar to how it was in the first: it’s not the result of indisputable facts, but based on moral judgments and subjective intuitions.
For one part of the life-saving-vs-life-improving comparison, the location of the ‘neutral point’ is currently an understudied, open question. We think that further empirical research can help, and we are undertaking some now – see this other recent report. For the other part, which view of badness of death we should take – should we prioritise the youngest? Or should we prioritise infants over adults? Or prioritise living well over living long? – this a well-worn moral philosophy question (and not amenable to data) but decision-makers could certainly think about it more to better form their views. In general, because these issues can make such a difference, we think we should pay close attention to them, which is why we consider GiveWell’s treatment to have been too brief.
Overall, we are really pleased that GiveWell has engaged with this work and produced this report. While we disagree with some aspects of the analysis and agree with others, there is plenty to be done to improve our collective understanding here, and we plan to incorporate insights from this discussion into our subsequent analyses of StrongMinds, and similar programmes. As we continue to search for the best ways to worldwide wellbeing, we would be very happy to collaborate with GiveWell, or anyone else, to find out what these are.
Joel’s technical response
Summary
Alex’s post has two parts. First, what is the estimated impact of StrongMinds in terms of WELLBYs? Second, how cost-effective is StrongMinds compared to the Against Malaria Foundation (AMF)? I briefly present my conclusions to both in turn. More detail about each point is presented in Sections 1 and 2 of this comment.
The cost-effectiveness of StrongMinds
GiveWell estimates that StrongMinds generates 1.8 WELLBYs per treatment (17 WELLBYs per $1000, or 2.3x GiveDirectly49). Our most recent estimate50 is 10.5 WELLBYs per treatment (62 WELLBYs per $1000, or 7.5x GiveDirectly) . This represents a 83% discount (an 8.7 WELLBYs gap) to StrongMinds effectiveness51. These discounts, while sometimes informed by empirical evidence, are primarily subjective in nature. Below I present the discounts, and our response to them, in more detail.
Figure 1: Description of GiveWell’s discounts on StrongMinds’ effect, and their source
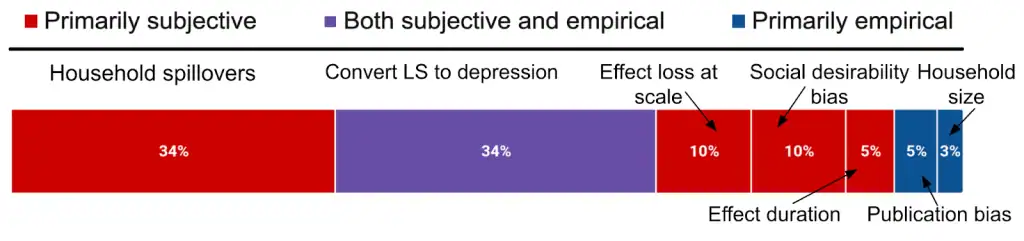
Notes: The graph shows the factors that make up the 8.7 WELLBY discount.
Table 1: Disagreements on StrongMinds per treatment effect (10.5 vs. 1.8 WELLBYs) and cost
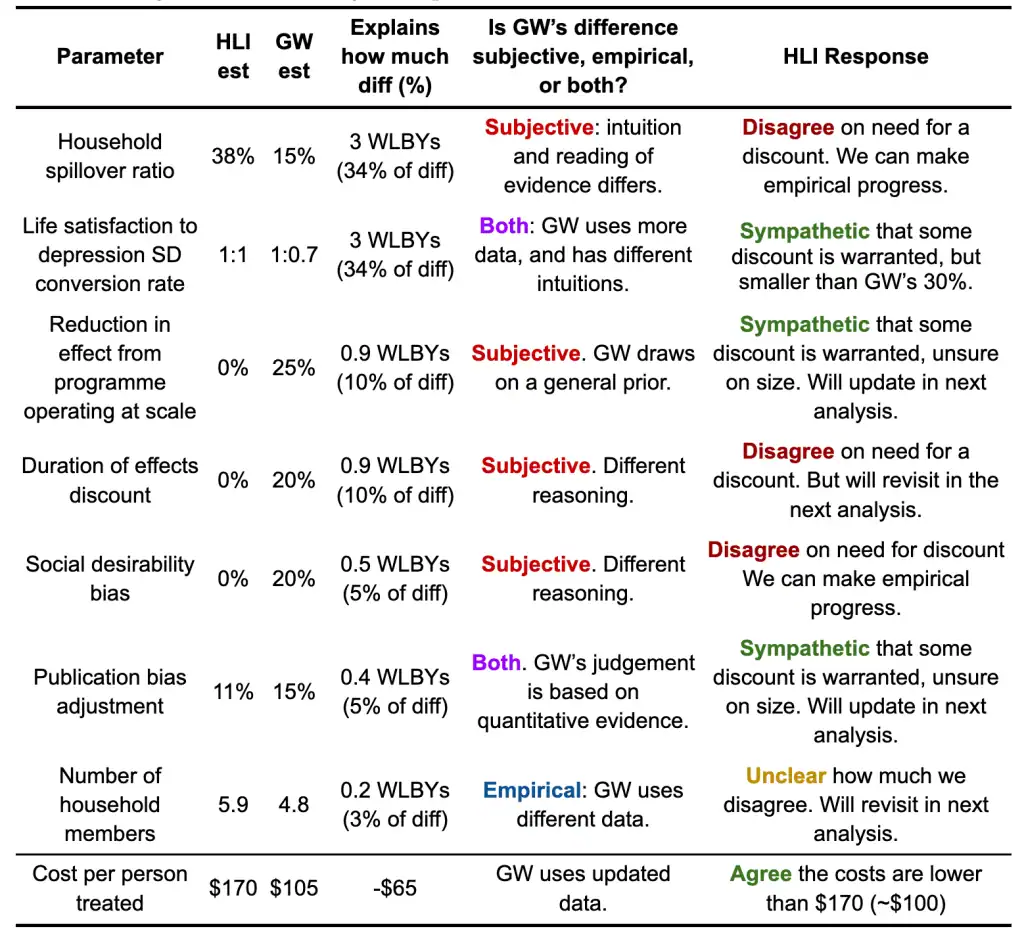
Note: HLI estimates StrongMinds has an effect of 1.8 WELLBYs per household of recipient. HLI estimates that this figure is 10.5. This represents a 8.7 WELLBY gap.
How do we assess GiveWell’s discounts? We summarise our position below.
Figure 2: HLI’s views on GiveWell’s total discount of 83% to StrongMind’s effects
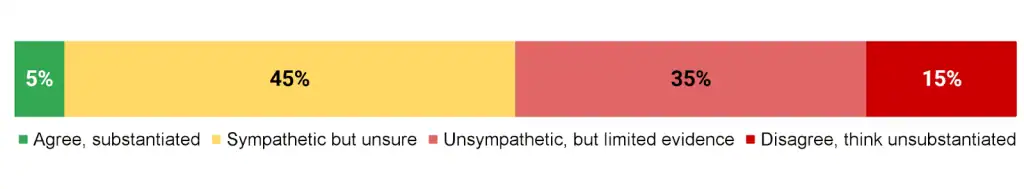
- We think there’s sufficient evidence and reason to justify the size and magnitude of 5% of GiveWell’s total discount
- For ~45% of their total discount, we are sympathetic to including a discount, but we are unsure about the magnitude (generally, we think the discount would be lower). The adjustments that I think are the most plausible are:
- A discount of up to 15% for conversion between depression and life-satisfaction SD.
- A discount of up to 20% for loss of effectiveness at scale.
- A discount of up to 5% for response biases.
- Reducing the household size down to 4.8 people.
- We are unsympathetic to ~35% of their total discount, because our intuitions differ, but there doesn’t appear to be sufficient existing evidence to settle the matter (i.e., household spillovers).
- We think that for 15% of their total discount, the evidence that exists doesn’t seem to substantiate a discount (i.e., their discounts on StrongMind’s durability).
However, as Michael mentions in his comment, a general source of uncertainty we have is about how and when to make use of subjective discounts. We will make more precise claims about the cost-effectiveness of StrongMinds when we finalise our revision and expansion.
The cost-effectiveness of AMF
The second part of Alex’s post is asking how cost-effective is StrongMinds compared to the Against Malaria Foundation (AMF)? AMF, which prevents malaria with insecticide treated bednets, is in contrast to StrongMinds, a primarily life-saving intervention. Hence, as @Jason rightly pointed out elsewhere in the comments, its cost-effectiveness strongly depends on philosophical choices about the badness of death and the neutral point (see Plant et al., 2022). GiveWell takes a particular set of views (deprivationism with a neutral point of 0.5) that are very favourable to life saving interventions. But there are other plausible views that can change the results, and even make GiveWell’s estimate of StrongMinds seem more cost-effective than AMF. Whether you accept our original estimate of StrongMinds, or GiveWell’s lower estimate, the comparison is still incredibly sensitive to these philosophical choices. I think GiveWell is full of incredible social scientists, and I admire many of them, but I’m not sure that should privilege their philosophical intuitions.
Further research and collaboration opportunities
We are truly grateful to GiveWell for engaging with our research on StrongMinds. I think we largely agree with GiveWell regarding promising steps for future research. We’d be keen to help make many of these come true, if possible. Particularly regarding: other interventions that may benefit from a SWB analysis, household spillovers, publication bias, the SWB effects of psychotherapy (i.e. not just depression), and surveys about views on the neutral point and the badness of death. I would be delighted if we could make progress on these issues, and doubly so if we could do so together.
1. Disagreements on the cost-effectiveness of StrongMinds
HLI estimates that psychotherapy produces 10.5 WELLBYs (or 62 per $1000, 7.5x GiveDirectly) for the household of the recipient, while GiveWell estimates that psychotherapy has about a sixth of the effect, 1.8 WELLBYs (17 per $1000 or 2.3x GiveDirectly52). In this section, I discuss the sources of our disagreement regarding StrongMinds in the order I presented in Table 1.
1.1 Household spillover differences
Household spillovers are our most important disagreement. When we discuss the household spillover effect or ratio we’re referring to the additional benefit each non-recipient member of the household gets, as a percentage of what the main recipient receives. We first analysed household spillovers in McGuire et al. (2022), which was recently discussed here. Notably, James Snowden pointed out a mistake we made in extracting some data, which reduces the spillover ratio from 53% to 38%.
GiveWell’s method relies on:
- Discounting the 38% figure citing several general reasons. (A) Specific concerns that the studies we use might overestimate the benefits because they focused on families with children that had high-burden medical conditions. (B) A shallow review of correlational estimates of household spillovers and found spillover ratios ranging from 5% to 60%.
- And finally concluding that their best guess is that the spillover percentage is 15 or 20%53, rather than 53% (what we used in December 2022) or 38% (what we would use now in light of Snowden’s analysis). Since their resulting figure is a subjective estimate, we aren’t exactly sure why they give that figure, or how much they weigh each piece of evidence.
Table 2: HLI and GiveWell’s views on household spillovers of psychotherapy
| Variable | HLI | GiveWell | Explains how much difference in SM’s effect (%) |
| Household spillover ratio for psychotherapy | 38% | 15% | 3 WELLBYs (34% of total gap) |
Note: The household spillover for cash transfers we estimated is 86%.
I reassessed the evidence very recently – as part of the aforementioned discussion with James Snowden – and Alex’s comments don’t lead me to update my view further. In my recent analysis, I explained that I think I should weigh the studies we previously used less because they do seem less relevant to StrongMinds, but I’m unsure what to use instead. And I also hold a more favourable intuition about household spillovers for psychotherapy, because parental mental health seems important for children (e.g., Goodman, 2020).
But I think we can agree that collecting and analysing new evidence could be very important here. The data from Barker et al. (2022), a high quality RCT of the effect of CBT on the general population in Ghana (n = ~7,000) contains information on both partners’ psychological distress when one of them received cognitive behavioural therapy, so this data can be used to estimate any spousal spillover effects from psychotherapy. I am in the early stage of analysing this data54. There also seems to be a lot of promising primary work that could be done to estimate household spillovers alongside the effects of psychotherapy.
1.2 Conversion between measures, data sources, and units
The conversion between depression and life-satisfaction (LS) scores ties with household spillovers in terms of importance for explaining our disagreements about the effectiveness of psychotherapy. We’ve previously assumed that a one standard deviation (SD) decrease in depression symptoms (or affective mental health; MHa) is equivalent to a one SD improvement in life-satisfaction or happiness (i.e., a 1:1 conversion), see here for our previous discussion and rationale.
Givewell has two concerns with this:
- Depression and life-satisfaction measures might not be sufficiently empirically or conceptually related to justify a 1:1 conversion. Because of this, they apply an empirically based 10% discount.
- They are concerned that recipients of psychotherapy have a smaller variance in subjective wellbeing (SWB) than general populations (e.g., cash transfers), which leads to inflated effect sizes. They apply a 20% subjective discount to account for this.
Hence, GiveWell applied a 30% discount (see Table 4 below).
Table 3: HLI and GiveWell’s views on converting between SDs of depression and life satisfaction
| Variable | HLI | GiveWell | Explains what difference in SM’s effect (%) |
| Conversion from depression to LS | 1 to 1 | 1 to 0.7 | 3 WELLBYs (34% of total) |
Overall, I agree that there are empirical reasons for including a discount in this domain, but I’m unsure of its magnitude. I think it will likely be smaller than GiveWell’s 30% discount.
1.2.1 Differences between the two measures
First, GiveWell mentions a previous estimate of ours suggesting that mental health (MH) treatments55 impact depression 11% more than SWB. Our original calculation used a naive average, but on reflection, it seems more appropriate to use a sample-size-weighted average (because of the large differences in samples between studies), which results in depression measures overestimating SWB measures by 4%, instead of 11%.
Results between depression and happiness measures are also very close in Bhat et al. (2022; n = 589), the only study I’ve found so far that looks at effects of psychotherapy on both types of measures. We can standardise the effects in two ways. Depending on the method, the SWB effects are larger by 18% or smaller by 1% than MHa effects56. Thus, effects of psychotherapy on depression appear to be of similar size as effects on SWB. Given these results, I think the discount due to empirical differences could be smaller than 10%, I would guess 3%.
Another part of this is that depression and life satisfaction are not the same concept. So if the scores are different, there is a further moral question about which deserves more weight. The HLI ‘house view’, as our name indicates, favours happiness (how good/bad we feel) as what matters. Further, we suspect that measures of depression are conceptually closer to happiness than measures of life satisfaction are. Hence, if push came to shove, and there is a difference, we’d care more about the depression scores, so no discount would be justified. From our conversation with Alex, we understand that the GiveWell ‘house view’ is to care more about life satisfaction than happiness. In this case, GiveWell would be correct, by their lights, to apply some reduction here.
1.2.2 Differences in variance
In addition to their 11% conversion discount, GiveWell adds another 20% discount because they think a sample of people with depression have a smaller variance in life satisfaction scores.57 Setting aside the technical topic of why variance in variances matters, I investigated whether there are lower SDs in life satisfaction when you screen for baseline depression using a few datasets. I found that, if anything, the SDs are larger by 4% (see Table 4 below). Although I see the rationale behind GiveWell’s speculation, the evidence I’ve looked at suggests a different conclusion.
Table 4: Life-satisfaction SD depending on clinical mental health cutoff
| Dataset | LS SD for general pop | LS SD for dep pop | SWB SD change (gen → dep) | SWB measure |
| BHPS (UK, n = 7,310) | 1.23 | 1.30 | 106% | LS 1-10 |
| HILDA (AUS, n = 4,984) | 1.65 | 1.88 | 114% | LS 0-10 |
| NIDS (SA, n = 18,039) | 2.43 | 2.38 | 98% | LS 1-10 |
| Haushofer et al. 2016 (KE, n = 1,336) | 1.02 | 1.04 | 102% | LS (z-score) |
| Average change | 1.58 | 1.65 | 104% |
Note: BHPS = The British Household Panel Survey, HILDA = The Household Income and Labour Dynamics Survey, NIDS = National Income Dynamics Study. LS = life satisfaction, dep = depression.
However, I’m separately concerned that SD changes in trials where recipients are selected based on depression (i.e., psychotherapy) are inflated compared to trials without such selection (i.e., cash transfers)58.
Overall, I think I agree with GiveWell that there should be a discount here that HLI doesn’t implement, but I’m unsure of its magnitude, and I think that it’d be smaller than GiveWell’s. More data could likely be collected on these topics, particularly how much effect sizes in practice differ between life-satisfaction and depression, to reduce our uncertainty.
1.3 Loss of effectiveness outside trials and at scale
GiveWell explains their concern, summarised in the table below:
“Our general expectation is that programs implemented as part of randomized trials are higher quality than similar programs implemented at scale. […] For example, HLI notes that StrongMinds uses a reduced number of sessions and slightly reduced training, compared to Bolton (2003), which its program is based on.48 We think this typeof modification could reduce program effectiveness relative to what is found in trials. […] We can also see some evidence for lower effects in larger trials…”
Table 5: HLI and GiveWell’s views on an adjustment for StongMind’s losing effectiveness at scale
| Variable | HLI | Give Well | Explains what difference in SM’s effect (%) |
|---|---|---|---|
| Loss of effect at scale discount | 0% | 25% | 0.9 WELLBYs (10.1% of total gap) |
While GiveWell provides several compelling reasons for why StongMinds efficacy will decrease as it scales, I can’t find the reason GiveWell provides for why these reasons result in a 25% discount. It seems like a subjective judgement informed by some empirical factors and perhaps from previous experience studying this issue (e.g., cases like No Lean Season). Is there any quantitative evidence that suggests that when RCT interventions scale they drop 25% in effectiveness? While GiveWell also mentions that larger psychotherapy trials have smaller effects, I assume this is driven by publication bias (discussed in Section 1.6). I’m also less sure that scaling has no offsetting benefits. I would be surprised if when RCTs are run, the intervention has all of its kinks ironed out. In fact, there’s many cases of the RCT version of an intervention being the “minimum viable product” (Karlan et al., 2016). While I think a discount here is plausible, I’m very unsure of its magnitude.
In our updated meta-analysis we plan on doing a deeper analysis of the effect of expertise and time spent in therapy, and to use this to better predict the effect of StrongMinds. We’re awaiting the results from Baird et al. which should better reflect their new strategy as StrongMinds trained but did not directly deliver the programme.
1.4 Disagreements on the durability of psychotherapy
GiveWell explains their concern summarised in the table below, “We do think it’s plausible that lay-person-delivered therapy programs can have persistent long-term effects, based on recent trials by Bhat et al. 2022 and Baranov et al. 2020. However, we’re somewhat skeptical of HLI’s estimate, given that it seems unlikely to us that a time-limited course of group therapy (4-8 weeks) would have such persistent effects. We also guess that some of the factors that cause StrongMinds’ program to be less effective than programs studied in trials (see above) could also limit how long the benefits of the program endure. As a result, we apply an 80% adjustment factor to HLI’s estimates. We view this adjustment as highly speculative, though, and think it’s possible we could update our view with more work.”
Table 6: HLI and GiveWell’s views on a discount to account for a decrease in durability
| Variable | HLI | Give Well | Explains what difference in SM’s effect (%) |
| Decrease in durability | 0% | 20% | 0.9 WELLBYs (10.1% of total gap) |
Since this disagreement appears mainly based on reasoning, I’ll explain why my intuitions – and my interpretation of the data – differ from GiveWell here. Baranov et al. (2020) and Bhat et al. (2022) both find long-term effects that are greater than what our model predicts. I show how these studies compare to our model in Figure 3 below.
Figure 3: Effects of our model over time, and the only long-term psychotherapy studies in LMICs
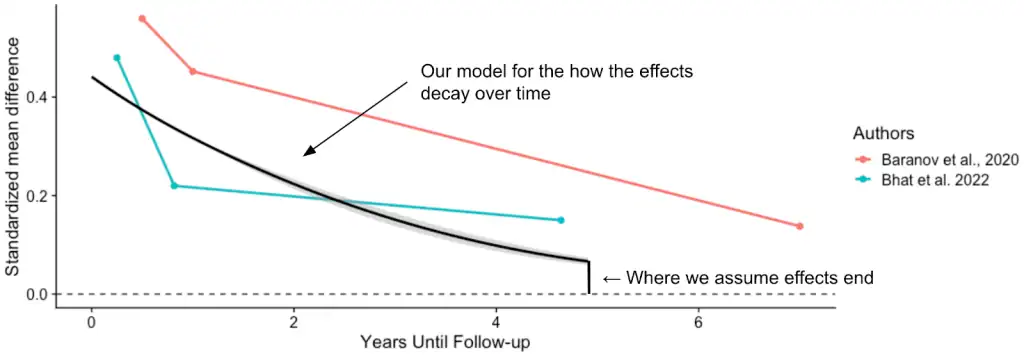
Baranov et al. (2020, 16 intended sessions) and Bhat et al. (2022, 6-14 intended sessions, with 70% completion rate) were both time limited. StrongMinds historically used 12 sessions (it may be 8 now) of 90 minutes59. Therefore, our model is more conservative than the Baranov et al. result, and closer to the Bhat et al. which has a similar range of sessions. Another reason, in favour of the duration of StrongMinds, which I mentioned in McGuire et al. (2021), is that 78% of groups continued meeting on their own at least six months after the programme formally ended.
Bhat et al. (2022) is also notable in another regard: They asked ~200 experts to predict the impact of the intervention after 4.5 years. The median prediction underestimated the effectiveness by nearly 1/3rd, which makes me inclined to weigh expert priors less here60.
Additionally, there seems to be something double-county in GiveWell’s adjustments. The initial effect is adjusted by 0.75 for “Lower effectiveness at scale and outside of trial contexts” and the duration effect is adjusted by 0.80, also for “lower effectiveness at scale and outside of trial contexts”. Combined this is a 0.55 adjustment instead of one 0.8 adjustment. I feel like one concern should show up as one discount.
1.5 Disagreements on social desirability bias
GiveWell explains their concern, which is summarised in the table below: “One major concern we have with these studies is that participants might report a lower level of depression after the intervention because they believe that is what the experimenter wants to see […] HLI responded to this criticism [section 4.4] and noted that studies that try to assess experimenter-demand effects typically find small effects.[…] We’re not sure these tests would resolve this bias so we still include a downward adjustment (80% adjustment factor).”
Table 7: HLI and GiveWell’s views on converting between SDs of depression and life satisfaction
| Variable | HLI | GiveWell | Explains what diff in SM’s effect (%) |
| Social desirability bias discount | 0% | 20% | 0.5 WELLBYs (5.1% of total gap) |
Participants might report bigger effects to be agreeable with the researchers (socially driven bias) or in the hopes of future rewards (cognitively driven bias; Bandiera et al., 2018), especially if they recognise the people delivering the survey to be the same people delivering the intervention62.
But while I also worry about this issue, I am less concerned than GiveWell that response bias poses a unique threat to psychotherapy. Because if this bias exists, it seems likely to apply to all RCTs of interventions with self-reported outcomes (and without active controls). So I think the relevant question is why the propensity to response bias might differ between cash transfers and psychotherapy? Here are some possibilities:
- It seems potentially more obvious that psychotherapy should alleviate depression than cash transfers should increase happiness. If so, questions about self-reported wellbeing may be more subject to bias in psychotherapy trials63.
- We could expect that the later the follow-up, the less salient the intervention is, the less likely respondents are to be biased in this way (Park & Kumar, 2022). This is one possibility that could favour cash transfers because they have relatively longer follow-ups than psychotherapy.
- However, it is obvious to cash transfer participants whether they are in the treatment (they receive cash) or control conditions (they get nothing). This seems less true in psychotherapy trials where there are often active controls.
GiveWell responded to the previous evidence I cited (McGuire & Plant, 2021, Section 4.4)64 by arguing that the tests run in the literature, by investigating the effect of the general propensity towards socially desirable responding or the expectations of surveyor, are not relevant because: “If the surveyor told them they expected the program to worsen their mental health or improve their mental health, it seems unlikely to overturn whatever belief they had about the program’s expected effect that was formed during their group therapy sessions.” But, if participants’ views about an intervention seem unlikely to be overturned by what the surveyor seems to want – when what the surveyor wants and the participant’s experience differs – then that’s a reason to be less concerned about socially motivated response bias in general.
However, I am more concerned with socially desirable responses driven by cognitive factors. Bandiera et al. (2018, p. 25) is the only study I found to discuss the issue, but they do not seem to think this was an issue with their trial: “Cognitive drivers could be present if adolescent girls believe providing desirable responses will improve their chances to access other BRAC programs (e.g. credit). If so, we might expect such effects to be greater for participants from lower socioeconomic backgrounds or those in rural areas. However, this implication runs counter to the evidence in Table A5, where we documented relatively homogenous impacts across indices and time periods, between rich/poor and rural/urban households.”
I agree with GiveWell that more research would be very useful, and could potentially update my views considerably, particularly with respect to the possibility of cognitively driven response bias in RCTs deployed in low-income contexts.
1.6 Publication bias
GiveWell explains their concern, which we summarise in the table below: “HLI’s analysis includes a roughly 10% downward adjustment for publication bias in the therapy literature relative to cash transfers literature. We have not explored this in depth but guess we would apply a steeper adjustment factor for publication bias in therapy relative to our top charities. After publishing its cost-effectiveness analysis, HLI published a funnel plot showing a high level of publication bias, with well-powered studies finding smaller effects than less-well-powered studies.57 This is qualitatively consistent with a recent meta-analysis of therapy finding a publication bias of 25%.”
Table 8: HLI and GiveWell’s views on a publication bias discount
| Variable | HLI | GiveWell | Explains what diff in SM’s effect (%) |
| Publication bias discount | 11% | 15% | 0.39 WELLBYs (4.5% of total gap) |
After some recent criticism, we have revisited this issue and are working on estimating the bias empirically. Publication bias seems like a real issue, where a 10-25% correction like what GiveWell suggests seems plausible, but we’re unsure about the magnitude as our research is ongoing. In our update of our psychotherapy meta-analysis we plan to employ a more sophisticated quantitative approach to adjust for publication bias.
1.7 Household size
GiveWell explains their concern, which we summarise in the table below: “HLI estimates household size using data from the Global Data Lab and UN Population Division. They estimate a household size of 5.9 in Uganda based on these data, which appears to be driven by high estimates for rural household size in the Global Data Lab data, which estimate a household size of 6.3 in rural areas in 2019. A recent Uganda National Household Survey, on the other hand, estimates household size of 4.8 in rural areas. We’re not sure what’s driving differences in estimates across these surveys, but our best guess is that household size is smaller than the 5.9 estimate HLI is using.”
Table 9: HLI and GiveWell’s views on household size of StrongMind’s recipients
| Variable | HLI | GiveWell | Explains what diff in SM’s effect (%) |
| Household size for StrongMinds | 5.9 | 4.8 | 0.39 WELLBYs (4.5% of total gap) |
I think the figures GiveWell cites are reasonable. I favour using international datasets because I assume it means greater comparability between countries, but I don’t feel strongly about this. I agree it could be easy and useful to try and understand StrongMinds recipient’s household sizes more directly. We will revisit this in our StrongMinds update.
1.8 Cost per person of StrongMinds treated
The one element where we differ that makes StrongMinds look more favourable is cost. As GiveWell explains “HLI’s most recent analysis includes a cost of $170 per person treated by StrongMinds, but StrongMinds cited a 2022 figure of $105 in a recent blog post”
Table 10: HLI and GiveWell’s views on cost per person for StrongMind’s treatment
| Variable | HLI | GiveWell | % Total Gap Explained |
| cost per person of StrongMinds | $170 | $105 | -75% |
According to their most recent quarterly report, a cost per person of $105 was the goal, but they claim $74 per person for 202265. We agree this is a more accurate/current figure, and the cost might well be lower now. A concern is that the reduction in costs comes at the expense of treatment fidelity – an issue we will review in our updated analysis.
2. GiveWell’s cost-effectiveness estimate of AMF is dependent on philosophical views
GiveWell estimates that AMF produces 70 WELLBYs per $100066, which would be 4 times better than StrongMinds. GiveWell described the philosophical assumptions of their life saving analysis as: “…Under the deprivationist framework and assuming a “neutral point” of 0.5 life satisfaction points. […] we think this is what we would use and it seems closest to our current moral weights, which use a combination of deprivationism and time-relative interest account.“
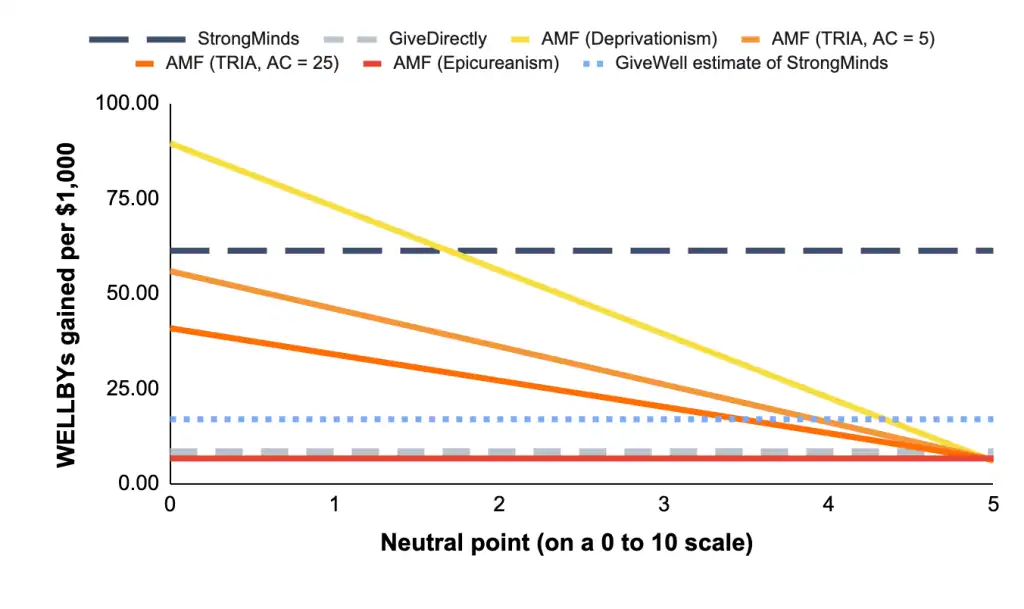
Hence, they conclude that AMF produces 70 WELLBYs per $1000, which makes StrongMinds 0.24 times as cost-effective as AMF. However, the position they take is nearly the most favourable one can take towards interventions that save lives67. But there are other plausible views about the neutral point and the badness of death (we discuss this in Plant et al., 2022). Indeed, assigning credences to higher neutral points68 or alternative philosophical views of death’s badness will reduce the cost-effectiveness of AMF relative to StrongMinds (see Figure 3). In some cases, AMF is less cost-effective than GiveWell’s estimate of StrongMinds69.
Figure 4: Cost-effectiveness of charities under different philosophical assumptions (with updated StrongMinds value, and GiveWell’s estimate for StrongMinds)
To be clear, HLI does not (yet) take a stance on these different philosophical views. While I present some of my views here, these do not represent HLI as a whole.
Personally, I’d use a neutral point closer to 2 out of 1070. Regarding the philosophy, I think my credences would be close to uniformly distributed across the Epicurean, TRIA, and deprivationist views. If I plug this view into our model introduced in Plant et al. (2022) then this would result in a cost-effectiveness for AMF of 29 WELLBYs per $1000 (rather than 81 WELLBYs per $1000)71, which is about half as good as the 62 WELLBYs per $1000 for StrongMinds. If GiveWell held these views, then AMF would fall within GiveWell’s pessimistic and optimistic estimates of 3-57 WELLBYs per $1000 for StrongMinds’ cost-effectiveness. For AMF to fall above this range, you need to (A) put almost all your credence in deprivationism and (B) have a neutral point lower than 272.