Our friends at the World Happiness Report have just published their 2025 rankings, based on self-reported happiness. We also wrote a chapter for the report! Read on to learn more.
Once again, the Nordic countries claim the top spots, with Finland retaining its title as the world’s happiest country. These wealthy, homogenous, high-trust states with generous welfare systems continue to dominate the rankings (we assume it doesn’t have to do with the pickled fish).
The UK and United States may be countries that pride themselves on their exceptionalism, but they are not exceptionally satisfied with life – barely making the top 25.
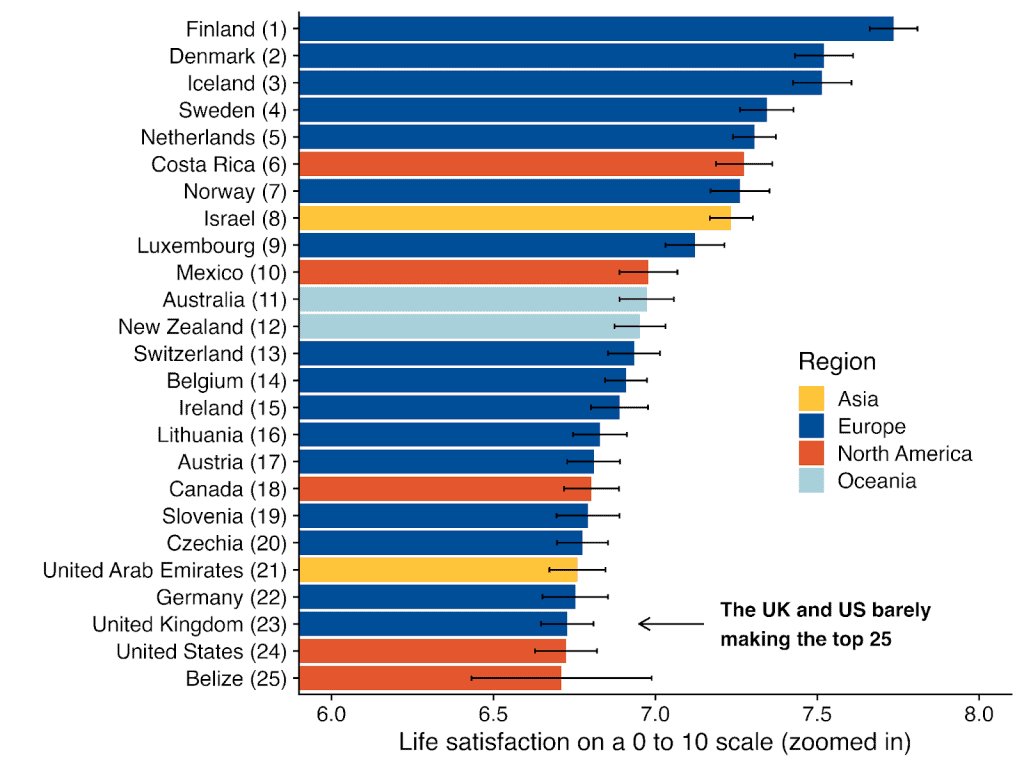
Note. This is our own figure, based on data presented in the 2025 World Happiness Report. The happiness levels are an average of the years 2022, 2023, and 2024. The error bars are 95% confidence intervals. For the full list of countries and their happiness in 2025, see the end of this article.
Some of the world’s happiest countries buy wellbeing for WAY cheaper than others
Richer countries tend to be happier. Nevertheless, several Latin American countries continue to outperform expectations based on income alone. Residents of Costa Rica report higher life satisfaction than Americans (and Mexican life satisfaction is very close to that of the US), despite having less than half the income.
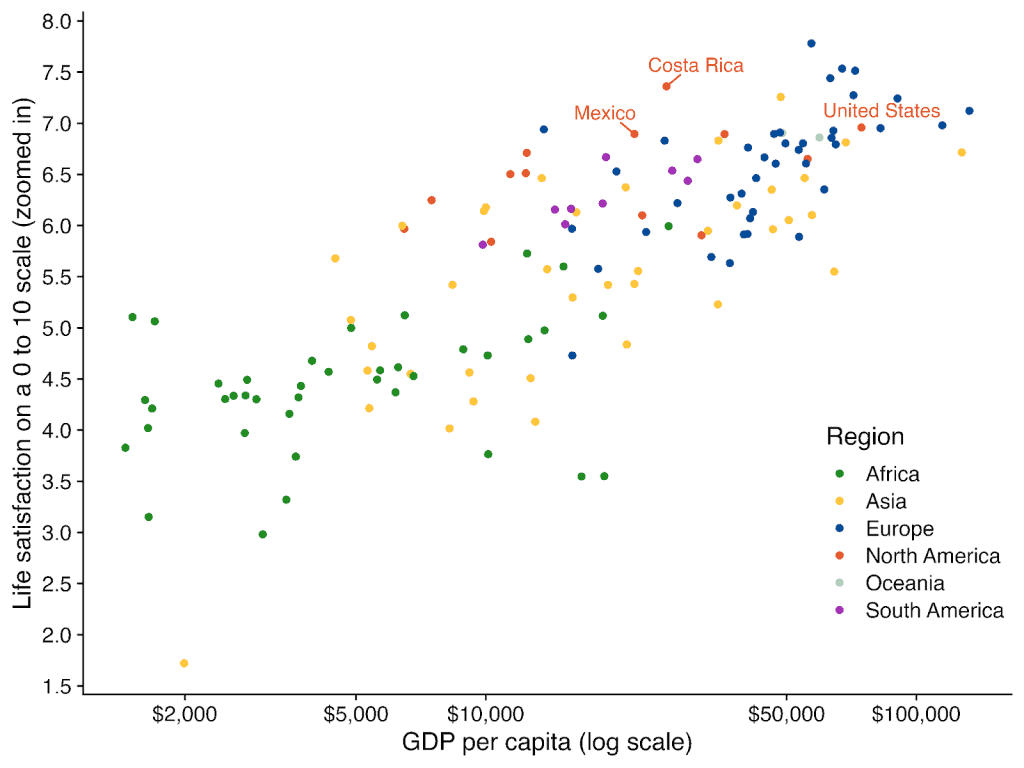
Note. This is our own figure. The life satisfaction data is from 2024 (or 2023 for countries missing 2024 data). The GDP data is from 2023 (the World Bank has not yet released 2024 data). We accessed the GDP data from Our World in Data.
Some of the world’s happiest countries in 2025 are also the most generous
Being a happy country is good. But spreading that happiness beyond one’s borders is even better. This year’s World Happiness Report highlights the often-overlooked role of benevolence in improving the lives of the giver and receiver.
One clear way to measure a country’s generosity is through its levels of international aid. In the World Happiness Report (Chapter 2, p. 46), they found a positive correlation between international aid and a country’s happiness.
Indeed, when we visually look at foreign aid as a share of national income, an interesting pattern emerges: the world’s happiest countries also tend to be among the most generous.
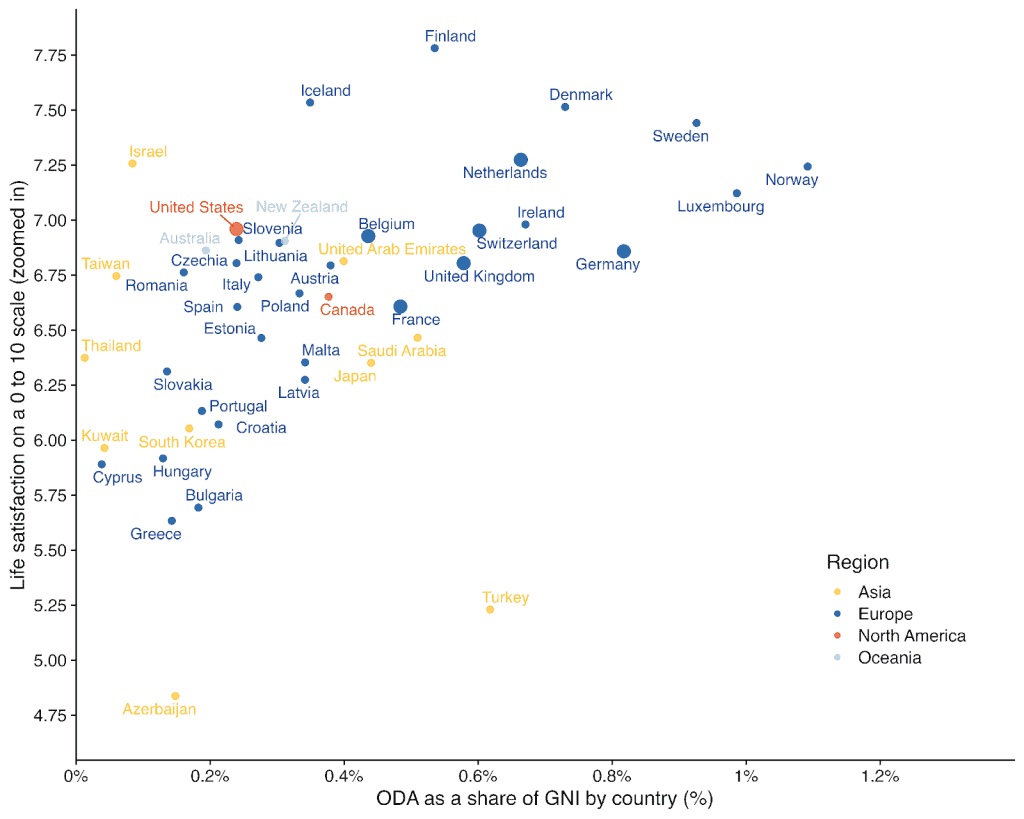
Note. This is our own figure. The life satisfaction data is from 2024 (or 2023 for countries missing 2024 data). The Official Development Assistance (ODA) data is from 2023 (the OECD has not yet released 2024 data). We accessed ODA data from Our World in Data. Some countries that have recently announced cuts to their foreign aid (USA, UK, etc.) are represented with larger points.
The connection between helping others and happiness is mirrored on the individual scale. Being more generous is correlated with being happier. Among the generous acts surveyed, donating has twice as large a happiness boost than volunteering or helping strangers (p. 40). Luckily, acts of benevolence may be more common than we imagine.
People are kinder than we think
One of our favourite findings from this year’s report suggests that people are worthier of our trust than we realise.
In Chapter 2 (p. 31), the authors compared survey results about people’s expectations for how often a dropped wallet would be returned with actual return rates from a 40-country experiment.
They found that the actual return rate across the world was about twice as high as people expected.

These expectations are also strongly and positively related to wellbeing. Having confidence that a wallet would be returned had a much higher associated effect on happiness than most other factors.
Believing a wallet would be returned was twice as related to happiness as unemployment and it was correlated with nearly 8 times as much happiness as having one’s income double.
The authors draw out the implication:
“people may be made needlessly unhappy by their unwarranted pessimism.” (p. 31)
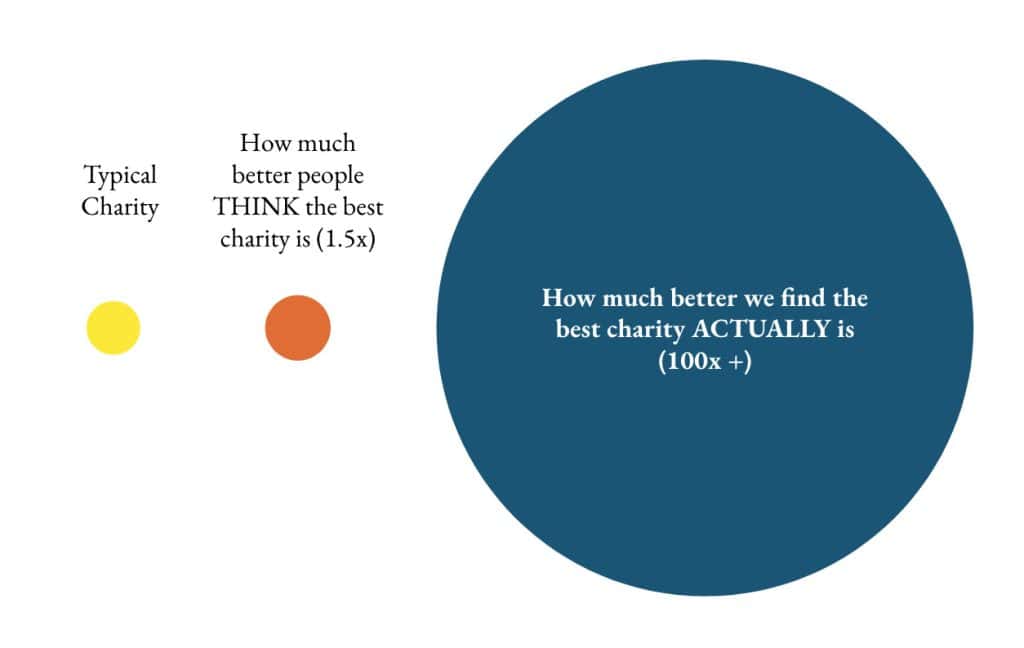
The best ways to do good are HUNDREDS of times better than others
Just as people are too pessimistic about the kindness of strangers, they also seem to be far too downbeat on the chance that they can do an incredible amount of good.
Most people think the best charity to help the global poor is around 1.5x as good as the typical charity. But is that really the case?
We recently wrote a chapter for the 2025 World Happiness Report that attempts to answer this very question.
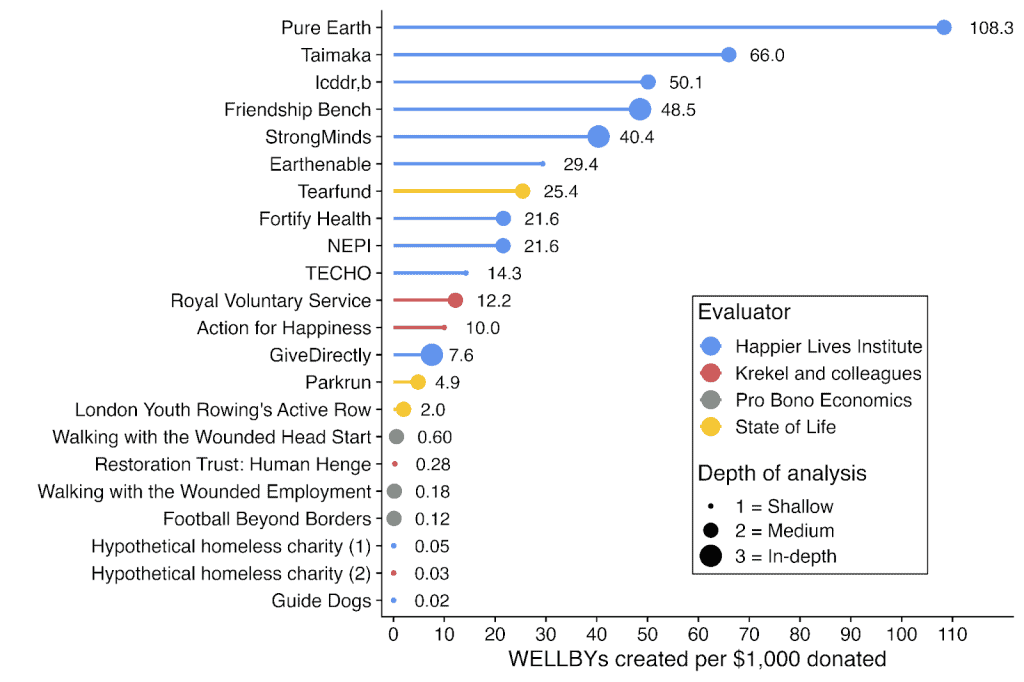
Based on our analysis of the data, we (and other experts) think the difference between the best and the rest of charities is much, much larger. This is illustrated in the graph below, but let us tell you why in more detail.
In our chapter (Chapter 8) we compiled all the cost-effectiveness analyses of charities we could find that use wellbeing as the outcome. Using wellbeing-years (WELLBYs) an increasingly accepted and standardised metric of value, we are able to compare different charities in the same units.
1 WELLBY = A 1-point increase on a 0-10 self-reported wellbeing scale for one person for one year. For context, after a year:
- Being unemployed reduces life satisfaction by 0.5 points (on a 0-10 scale).
- Marriage increases life satisfaction by 0.3 points (on a 0-10 scale).
- Doubling income raises life satisfaction by 0.2 points (on a 0-10 scale).
By using WELLBYs, we can identify which charities create the most happiness per dollar.
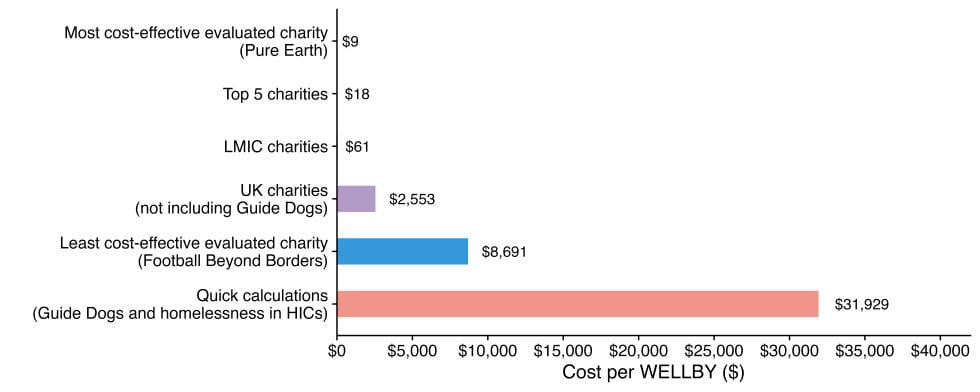
After performing our analysis we found that the cost-effectiveness of charities varies dramatically. From our dataset, we draw out three striking comparisons:
- The top 5 charities in our sample are around 150 times more cost-effective than the average of evaluated charities in the UK (not including Guide Dogs). Note we think the UK charities are more representative of typical charities, as few donations go overseas (between 5% and 15%).
- The evaluated charity with the highest cost-effectiveness (Pure Earth) is around ~1,000 times better (942 times to be precise) at increasing happiness than the least effective evaluated charity (Football Beyond Borders).
- But this is just the difference between charities that wanted to be evaluated! We also took a quick stab at estimating some very large and common acts of charity: Guide Dogs and helping the homeless. The best charity is ~3,500 times better than these popular destinations for our charitable dollars.
What this means is if we’re careful, we can potentially have the same impact when giving $1,000 to the best charities as giving:
- ~$150,000 to the average UK charity we analysed
- ~$3,500,000 towards a lower impact charitable cause.
Your donations have the power to transform lives. You’ve probably heard this for years, maybe your whole life. We think the evidence supports this — IF you choose wisely. By donating to the most effective charities, you can centuplicate (100x – or more!) your impact without spending an additional dollar.
What can you do? You can do a lot! Hopefully, much more than you imagined.
- Donate to highly impactful charities to maximise the good you do.
- Read our full chapter to learn more about the research behind these comparisons.
- Share our findings with others!
- Stay informed by following our newsletter (scroll down to reach the form).
- Support our research so that we can find even better opportunities.
- And reach out if you have any questions.
Top happiest countries 2025 ranking
| Country | Rank | Score |
| Finland | 1 | 7.736 |
| Denmark | 2 | 7.521 |
| Iceland | 3 | 7.515 |
| Sweden | 4 | 7.345 |
| Netherlands | 5 | 7.306 |
| Costa Rica | 6 | 7.274 |
| Norway | 7 | 7.262 |
| Israel | 8 | 7.234 |
| Luxembourg | 9 | 7.122 |
| Mexico | 10 | 6.979 |
| Australia | 11 | 6.974 |
| New Zealand | 12 | 6.952 |
| Switzerland | 13 | 6.935 |
| Belgium | 14 | 6.91 |
| Ireland | 15 | 6.889 |
| Lithuania | 16 | 6.829 |
| Austria | 17 | 6.81 |
| Canada | 18 | 6.803 |
| Slovenia | 19 | 6.792 |
| Czechia | 20 | 6.775 |
| United Arab Emirates | 21 | 6.759 |
| Germany | 22 | 6.753 |
| United Kingdom | 23 | 6.728 |
| United States | 24 | 6.724 |
| Belize | 25 | 6.711 |
| Poland | 26 | 6.673 |
| Taiwan | 27 | 6.669 |
| Uruguay | 28 | 6.661 |
| Kosovo | 29 | 6.659 |
| Kuwait | 30 | 6.629 |
| Serbia | 31 | 6.606 |
| Saudi Arabia | 32 | 6.6 |
| France | 33 | 6.593 |
| Singapore | 34 | 6.565 |
| Romania | 35 | 6.563 |
| Brazil | 36 | 6.494 |
| El Salvador | 37 | 6.492 |
| Spain | 38 | 6.466 |
| Estonia | 39 | 6.417 |
| Italy | 40 | 6.415 |
| Panama | 41 | 6.407 |
| Argentina | 42 | 6.397 |
| Kazakhstan | 43 | 6.378 |
| Guatemala | 44 | 6.362 |
| Chile | 45 | 6.361 |
| Vietnam | 46 | 6.352 |
| Nicaragua | 47 | 6.33 |
| Malta | 48 | 6.316 |
| Thailand | 49 | 6.222 |
| Slovakia | 50 | 6.221 |
| Latvia | 51 | 6.207 |
| Oman | 52 | 6.197 |
| Uzbekistan | 53 | 6.193 |
| Paraguay | 54 | 6.172 |
| Japan | 55 | 6.147 |
| Bosnia and Herzegovina | 56 | 6.136 |
| Philippines | 57 | 6.107 |
| South Korea | 58 | 6.038 |
| Bahrain | 59 | 6.03 |
| Portugal | 60 | 6.013 |
| Colombia | 61 | 6.004 |
| Ecuador | 62 | 5.965 |
| Honduras | 63 | 5.964 |
| Malaysia | 64 | 5.955 |
| Peru | 65 | 5.947 |
| Russia | 66 | 5.945 |
| Cyprus | 67 | 5.942 |
| China | 68 | 5.921 |
| Hungary | 69 | 5.915 |
| Trinidad and Tobago | 70 | 5.905 |
| Montenegro | 71 | 5.877 |
| Croatia | 72 | 5.87 |
| Jamaica | 73 | 5.87 |
| Bolivia | 74 | 5.868 |
| Kyrgyzstan | 75 | 5.858 |
| Dominican Republic | 76 | 5.846 |
| Mongolia | 77 | 5.833 |
| Mauritius | 78 | 5.832 |
| Libya | 79 | 5.82 |
| Republic of Moldova | 80 | 5.819 |
| Greece | 81 | 5.776 |
| Venezuela | 82 | 5.683 |
| Indonesia | 83 | 5.617 |
| Algeria | 84 | 5.571 |
| Bulgaria | 85 | 5.554 |
| North Macedonia | 86 | 5.503 |
| Armenia | 87 | 5.494 |
| Hong Kong | 88 | 5.491 |
| Albania | 89 | 5.411 |
| Tajikistan | 90 | 5.411 |
| Georgia | 91 | 5.4 |
| Nepal | 92 | 5.311 |
| Laos | 93 | 5.301 |
| Türkiye | 94 | 5.262 |
| South Africa | 95 | 5.213 |
| Mozambique | 96 | 5.19 |
| Gabon | 97 | 5.12 |
| Côte d’Ivoire | 98 | 5.102 |
| Iran | 99 | 5.093 |
| Congo | 100 | 5.03 |
| Iraq | 101 | 4.976 |
| Guinea | 102 | 4.929 |
| Namibia | 103 | 4.911 |
| Cameroon | 104 | 4.887 |
| Nigeria | 105 | 4.885 |
| Azerbaijan | 106 | 4.875 |
| Senegal | 107 | 4.856 |
| Palestine | 108 | 4.78 |
| Pakistan | 109 | 4.768 |
| Niger | 110 | 4.725 |
| Ukraine | 111 | 4.68 |
| Morocco | 112 | 4.622 |
| Tunisia | 113 | 4.552 |
| Mauritania | 114 | 4.542 |
| Kenya | 115 | 4.51 |
| Uganda | 116 | 4.461 |
| Gambia | 117 | 4.423 |
| India | 118 | 4.389 |
| Chad | 119 | 4.384 |
| Burkina Faso | 120 | 4.383 |
| Benin | 121 | 4.357 |
| Somalia | 122 | 4.347 |
| Mali | 123 | 4.345 |
| Cambodia | 124 | 4.341 |
| Ghana | 125 | 4.34 |
| Myanmar | 126 | 4.321 |
| Togo | 127 | 4.315 |
| Jordan | 128 | 4.31 |
| Liberia | 129 | 4.277 |
| Madagascar | 130 | 4.157 |
| Zambia | 131 | 3.912 |
| Ethiopia | 132 | 3.898 |
| Sri Lanka | 133 | 3.891 |
| Bangladesh | 134 | 3.851 |
| Egypt | 135 | 3.817 |
| Tanzania | 136 | 3.8 |
| Eswatini | 137 | 3.774 |
| Lesotho | 138 | 3.757 |
| Comoros | 139 | 3.754 |
| Yemen | 140 | 3.561 |
| Democratic Republic of the Congo | 141 | 3.469 |
| Botswana | 142 | 3.438 |
| Zimbabwe | 143 | 3.396 |
| Malawi | 144 | 3.26 |
| Lebanon | 145 | 3.188 |
| Sierra Leone | 146 | 2.998 |
| Afghanistan | 147 | 1.364 |