

Summary
Iron deficiency is the most common cause of anaemia, which impacts over 1.2 billion people worldwide. Anaemia often induces a sense of fatigue, tiredness or lethargy, which many consider a risk factor for depression. One way to address iron deficiency is through ‘fortification’, where vitamins or micronutrients are added to food to improve their nutritional content. Fortification is standard practice in high-income countries, but not universal in low-income countries.
In this shallow report, we spent around 90 hours examining the cost-effectiveness of an NGO, Fortify Health. Their model is to approach millers, persuade them to fortify their wheat, and then supply them the equipment and the micronutrient mixes required for free. They support fortification in the open market as well as with NGOs and the government – but we only focus on their open market programme here for simplicity. Fortification is, in general, very cheap, and only slightly increases the cost of flour. This means there’s a plausible case for iron fortification to be a very cost-effective way to improve wellbeing at scale, which is why we investigate it here.
This is part of our research to try and find the most cost-effective ways to increase wellbeing globally. We believe this report, alongside our analysis of Taimaka, is the first wellbeing cost-effectiveness analysis of a nutrition charity.
Why wellbeing? We evaluate charities with wellbeing-adjusted life years (WELLBYs)We did not invent the WELLBY; the approach is based on decades of research in social science (Brazier & Tsuchiya, 2015; Frijters et al., 2020; Layard & Oparina, 2021; Barrington-Leigh, 2022; McGuire et al., 2022), and is endorsed by the UK Treasury (HM Treasury, 2021).. The metric is simple: one WELLBY equals a 1-point increase on a 0-10 life satisfaction scale for one year. WELLBYs allow us to impartially compare the impact of very different charities addressing very different problems. While not without limitations, we think it is the best way (yet) of measuring wellbeing.
We found sufficient evidence to estimate the benefit of providing a year’s worth of fortified wheat to two distinct groups.
First, people who are anaemic (40% of the population in India). We estimate providing a year of fortified wheat flour has a 0.01 WELLBY effect for those in this group. This is based on 6 studies (4 correlational, 2 causal) of the link between anaemia and depression and 5 RCTs of the effect of wheat fortification on rates of anaemia.
Second, for children in utero, we estimate this provides a larger 0.4 WELLBY effect per person affected. This is based on one RCT of the 12-year effects of taking iron during pregnancy.
Ultimately, we estimate Fortify Health’s cost-effectiveness over the next three years to be 22 WELLBYs per $1,000 donated (WBp1k) or $46 per WELLBY. By comparison, we estimate this to be about three times as good as cash transfers (i.e., $132 per WELLBY; McGuire et al., 2022a). GiveDirectly is an NGO which provides cash transfers to impoverished households. We take cash transfers as a useful benchmark because they are a straightforward, plausibly cost-effective intervention with a solid evidence base. For more detailed and updated charity comparisons, see our charity evaluations page.
However, this estimate indicates that Fortify Health is about half as cost-effective as treating depression at scale (40 to 49 WBp1k, McGuire et al., 2024b). This leads us to conclude Fortify Health is a ‘good buy’ for improving wellbeing globally, but not among the ‘best buys’ we’ve found so far.
We compare Fortify Health to other charities and discuss our final verdict regarding whether we recommend it for funding on our websiteA recommendation depends on how the cost-effectiveness compares to other charities, some of which may not have been evaluated at the time of this report. . At the time of writing this, Fortify Health could absorb $6.5 million over the next three years (mid-2025 to mid-2027).
Because Fortify Health seems likely and capable of realising further economies of scale, decreasing the cost of fortification, we expect the cost-effectiveness to improve over time. But given our effect estimates, we don’t foresee this rising above 37 to 68 WBp1k.
We rate our depth of analysis as low and the quality of the available evidence also as low (i.e., weak). Our main uncertainty is about the causal relationship between anaemia and mental wellbeing. We think it’s quite possible that any research (there currently is none we know of) on the causal relationship between iron fortification and wellbeing could change our minds about the cost-effectiveness of fortifying iron.
Acknowledgements: We would like to recognise in these footnotes the contributions of authorsJM contributed to the conceptualization, investigation, analysis, data curation, and writing of the project. BS contributed to the analysis and data curation of this project. RD and MP contributed to the supervision, and writing of the project. , reviewersWe thank the following reviewers: Juan Benzo., and staff from the charities we have evaluatedWe thank Tony Senanayake and Tom Daniels for graciously providing very detailed information about Fortify Health and answering our many questions..
Outline
In Section 1 we provide an overview of the types of malnutrition and the extent of the problem.
In Section 2 we introduce iron fortification, and estimate its life-improving effect based on mostly correlational evidence.
In Section 3 we introduce Fortify Health which supports millers to fortify their wheat with iron in India.
In Section 4 we estimate the cost-effectiveness of Fortify Health.
In Section 5 we explain our confidence in the evidence and our analysis.
In Section 6 we conclude by giving our view of the cost-effectiveness of iron fortification of wheat and the promise of funding Fortify Health. We also discuss some opportunities for further research and their value.
0. Context: Exploring nutrition
This report is part of a broader project to find the most cost-effective ways to improve wellbeing globally. As part of this, we have been looking, more specifically, at the impact of nutritional interventions on subjective wellbeing (SWB) in low- and middle-income countries (LMICs). We consider this a first look at a broad and complex topic, and as a result, the implications are provisional.
Despite the vast literature on nutrition, we found little evidence about the effect of nutritional interventions on subjective wellbeing. This was not surprising given that the study of subjective wellbeing is relatively recent. We discuss our general search strategy for finding studies in Appendix A.
We used the evidence we found in this general exploration of nutrition to perform two very speculative cost-effectiveness analyses. One was about fortifying wheat with iron, which is discussed in this report. The other was about the community management of acute malnutrition (CMAM), which we covered in a separate report. (McGuire et al., 2024). We discuss the interventions that we didn’t investigate in Appendix B.
The introduction of this report is similar to that of our other nutrition report (c.f. the Taimaka report about treating acute malnutrition). Readers who have read the other report should feel free to skip to Section 2.
1. The problem: malnutrition
In this section we provide a general introduction to the problem nutrition interventions are typically trying to solve: malnutrition. We discuss possible interventions to address malnutrition and general mechanisms for nutrition to affect wellbeing.
1.1 Types of malnutrition
Nutrition, the intake of food with the elements necessary for health and bodily function, plays an important role in development (NIH). However, the types of possible nutrition interventions are vast, reflecting the complexity of malnutrition. Malnutrition, defined by WHO, “refers to deficiencies, excesses, or imbalances in a person’s intake of energy and/or nutrients.” Malnutrition can be chronic or acute.
Malnutrition can be further divided into two types:
- Undernutrition: a lack of sufficient caloric or macronutrient intake. The Food and Agriculture Organization (FAO) uses this synonymously with hunger. Undernutrition is often addressed by providing more and better food. This will take different forms depending on whether the undernutrition is acute or chronic.
- Micronutrient-related malnutrition: “Inadequacies in intake of vitamins and minerals” such as vitamin A, iodine, or iron (WHO, 2024). Micronutrient- related malnutrition is treated with nutritional supplements. These come in the form of multivitamins, specific supplements (e.g., vitamin-A), fortifying food (e.g., adding iodine to salt), or breeding crops to contain more essential nutrients.
In this report, we focus on micronutrient-related malnutrition, specifically iron deficiency and anaemia.
1.2 Iron deficiency and anaemia
Iron deficiency is the most common cause of anaemia (WHO, 2024), impacting over 1.2 billion people worldwide (Camaschella, 2021). Many metabolic processes rely on iron, including oxygen transport and storage, replication of DNA (Deoxyribonucleic acid) and RNA (Ribonucleic acid), and protein and electron transport (Man et al. 2021). Iron deficiency can affect birth weight, infant mortality, mental and motor development in young children, education, later-life income, physical capacity and energy levels (Lynch, 2005).
Anaemia is a condition of having lower than normal levels of red blood cells, which transport oxygen throughout the body. Iron is an essential part of the transportation of oxygen (it’s the iron that allows oxygen to bind to the haemoglobin in a red blood cell).
Solution
Iron supplementation appears to improve health and cognition through increasing haemoglobin concentration. Larson et al., (2019) finds across 56 RCTs of iron interventions that a 1 SD increase in haemoglobin relates to a short term increase in motor scores for children of 0.28 SDs and cognitive scores of 0.24 SDs (it is unclear what the long-term effects are).
2. Impact of iron fortification
In this section, we discuss the evidence we use to estimate the wellbeing impact of iron fortification.
First, we discuss the direct causal evidence of iron supplementation or fortification on wellbeing (Section 2.1). The evidence we use here is one causal study (an RCT) of iron supplementation on wellbeing. In that study, they estimated the long-term (12-year) effects of iron supplementation compared to nothing on the children of mothers who received it while pregnant (Zhu et al., 2023). The results are only suggestive of benefits (p = 0.057) and the intervention is only delivered to a relatively narrow subset of the general population (pregnant women).
Second, we discuss the indirect effects of iron fortification or supplementation on subjective wellbeing through its effects on anaemia, which is commonly assumed to be the primary mechanism for iron to improve wellbeing. This indirect evidence is composed of two parts which we discuss in Section 2.2.
- There is some causal evidence that iron supplementation reduces anaemia (5 RCTs, adults = 2,315, Field et al., 2021; 12 RCTs, children = 2,464; Pasricha et al., 2013).
- There is a large amount of evidence about the relationship between anaemia and mental health. Most of this evidence is correlational (e.g., n = 32,792,378, 15 studies, Kang et al., 2020). What potentially causal evidence there is has mixed findings. The two studies report both null and positive effects of anaemia on depression (Wang et al.,2023; Si et al., 2024).
2.1 Causal evidence of iron improving mental health
We have no causal evidence of iron fortification (adding small amounts of iron to a staple food) affecting mental health or subjective wellbeing. But we do have evidence of the effect on mental health of iron supplementation, providing a concentrated dose. Fortification often provides a smaller dose of a micronutrient to a general population (e.g., salt iodization). While supplementation typically means a higher dose to a more targeted, at-risk populationPopulations often considered at risk for anaemia add up to being a large part of the total population. They include non-pregnant women (WHO, 2024), pregnant women (Nils et al, 2017), children (Iglesias, Canals, and Arija 2018; Moreira-Araujo, Araujo, and Areas 2008), elderly (Wawer, Jennings, and Fairweather-Tait 2018), and athletes (Zoller and Vogel 2004). (e.g., iron pills for women of childbearing age). We attempt to deal with this generalizability concern later (Section 4.2) by assuming a nonlinear (concave) dose-response relationship to extrapolate from the higher dose of supplementation to the smaller dose of fortification.
Long-term causal wellbeing effects of iron supplementation
The only long-term causal evidence we have for iron supplementation is drawn from the effects of supplementation on a rather narrow subset of the population: children in utero. Zhu et al. (2023) was a follow-up to an RCT where mothers in the treatment arm were assigned to consume 60 mg of iron and folic acid daily during pregnancy (compared to a control group only receiving folic acid). They found that the children of mothers assigned iron, as young adolescents (average age = 12), had decreased self-reported anxiety and depression compared to those whose mothers were just assigned to receive folic acid (-0.11 SDs, n = 1,284). However, the results were not quite statistically significant (p = 0.054). Notably, this effect was for a sample of mothers drawn from the general population (37.6% had anaemia at baselineBaseline was before 28 weeks of pregnancy. It’s unclear when on average during pregnancy.). It’s unclear if the effects differ for the subset of mothers who had anaemia at baselineWe emailed the authors about this analysis but have not heard a response.. Anxiety and depression were measured using the anxiety and depression subscale of the Youth Self-Report scaleThis seems like a reasonable subscale to include since it asks typical MH questions like: “is it not true, sometimes true, or often true that you feel nervous or tense?”. And the subscale is highly correlated with other measures of depression (Ivarsson et al., 2002). .
We include these estimated effects in the cost-effectiveness analysis because it’s the most relevant causal evidence of the mental wellbeing effects of iron supplementation (compared to receiving a quasi-placeboWhile taking folic acid is recommended to prevent birth defects,the mechanism for iron deficiency to affect later wellbeing seems much more plausible. ).
The only other long-term causal study we found reported a near-zero effect of iron supplementation in the first year of life on mental health outcomes at 10 years (n = 1,032; Lozoff et al., 2014). However, Lozoff et al., (2014), strangely, studied the effects of iron supplementation on a cohort specifically selected for not having any iron deficiency. Giving iron to seemingly healthy children doesn’t appear relevant to a population such as India where Fortify Health works. India has anaemia rates in childhood of about 40%. Due to this lack of relevance we don’t assign this study any weight. This could be considered a generous move in favour of our analysis of Fortify health.
Given this limited evidence, with more time we think it’s worth exploring whether iron supplementation or fortification has any long-term effects on other outcomes that could cause an increase in wellbeing, such as health or cognitionIn a brief search we found no large scale studies or meta-analyses reporting long-run cognitive effectsof iron fortification. GiveWell doesn’t report any either.. There are short-term cognitive benefits of supplementation (Low et al., 2013) for children, but it’s unclear if these would be maintained over the long term or at the lower doses of iron that come with fortification.
Short term causal wellbeing effects of iron supplementation
There’s some mixed evidence of the effects of iron supplementation on perinatal depression. But the evidence is weak so we don’t use it. Tsai et al. (2023) report a large effect of iron supplementation (-0.98 SDs) on perinatal depression for women with depression at baseline, but only based on a tiny sample of studies (2 RCTs, n = 130). Nguyen et al. (2017), on a much larger sample (n = 1,616) report no effect of iron supplementation on depression symptoms in a general population of mothers (20% anaemic at baseline). They also found an effect of iron supplementation on depression for those who were the most depressed (top third). However, the authors didn’t describe the decision to analyse the effectiveness based on tertiles of baseline depression (and not the more intuitive breakdown by baseline anaemia which receives no mention). Therefore I interpret this result as potentially the due to sifting for positive findings.
We don’t include the effects of iron supplementation for pregnant women in the cost-effectiveness analysis for several reasonsNote, if we take the Nguyen et al. results at face value, it would barely add to the cost-effectiveness (0.01 WBp1k). This because we would be applying a 90% external validity adjustment because the supplementation dose is more than 10x the fortification dose, and because pregnant women make up a very small share of the population, . First, this evidence appears relatively weak (three studies). Second, there are null results for the general population of pregnant women (which would be more relevant to iron fortification). Lastly, the short-term effects may already be included based on the analysis we perform in the next section.
2.2 The indirect effects of iron on wellbeing: iron → anaemia & anaemia → wellbeing
Given the limited causal evidence of iron supplementation or fortification on mental wellbeing, we expanded our search to include the literature relating anaemia to mental health or subjective wellbeing.
We consider the pathway from iron fortification to anaemia and then from anaemia to mental wellbeing. We focus on this pathway because we think it is the main biological mechanism through which iron fortification might improve wellbeingThere may be other pathways through which iron fortification improves wellbeing. E.g., iron fortification may decrease malaria incidence by 13% (n = 1,958, Zlotkin et al., 2013). .
2.2.1 Causal evidence of iron fortification reducing anaemia
There’s direct evidence that finds that iron fortification of wheat decreases anaemia in the general population in LMICs (27% percent decline, 5 RCTs, n = 2,315, Field et al., 2021). There is also broader evidence about:
- The effect of iron supplementation in general on anaemia in children mostly from LMICs (50% decline, 32 RCTs, n = 7,089; Low et al., 2013).
- The effect of iron-fortified foods on anaemia in the general population (41% decline, 60 RCTs and CTs, Tarun et al., 2012).
- The effect on anaemia of daily supplementation with iron in small children (39% decline, 12 RCTs, n = 2,464; Pasricha et al., 2013).
- The effect of iron supplementation through iron fortified salts on reducing anaemia (20% decline, 22 RCTs and CTs, n = 52,758, Leila et al., 2021).
In our cost-effectiveness analysis we use the estimate for fortification’s effect on anaemia from a Cochrane meta-analysis, Field et al. (2021). They find that fortifying wheat flour reduces anaemia by 27% in the general population. We use this figure because it studies the effects of fortifying wheat flour (which Fortify Health does). While this effect is smaller than the general effect of supplementation found in Low et al. (2013) – the daily dose reported (10 to 300 mgs) for supplementation in that meta-analysis appears much larger than that in Fields et al. (2021) (4 to 6 mgs of iron). We also apply our typical 0.51 replicability adjustmentAs we’ve said elsewhere: The adjustment is calculated as a weighted average of the proportion of the size of effect sizes as replicated in replication studies in the broader social science literature: based on the results from Camerer (2018, n = 21), Open Science Collaboration (2015, n = 94) and the Multi-Lab studies (1,2,3,4; n = 77), as reported in Nosek et al. (2022). to the estimate from Fields et al. because the evidence was assessed as having “low certainty”. This results in our estimate that providing fortified wheat flour will reduce anaemia by 13.5%.
2.2.2 The effects of anaemia on wellbeing
There seem to be very plausible mechanisms relating anaemic iron deficiency to depression. It’s well established that anaemia causes feelings of tiredness and lethargy (Ferreira et al., 2019). It’s not hard to imagine that this could directly decrease mood or subjective wellbeing. There are also more indirect channels through which reducing anaemic iron deficiency could improve wellbeing such as through increasing cognitive or motor skills (Larson et al., 2019).
Evidence of the association between anaemia and affective mental health
There’s considerable correlational evidence relating anaemia to concurrent depressive or mental health issues. A relationship is found across a variety of populations:
- amongst children and adolescents (odds ratio = 2.34, n = 2,956; Chen et al. 2013),
- maternal depression (OR = 1.53, n = 32,792,378, 15 studies, Kang et al., 2020),
- geriatric depression (OR = 1.53, n = 1,876, Stewart et al., 2012)
- depression in the general population (OR = 1.43, n = unclear, 14 studies, Lee and Kim, 2020),
- a greater likelihood of psychiatric disorder in the general population (OR = 1.52, Herng-Sheng et al. 2020).
- The anaemia-depression relationship also appears to follow a dose- response pattern (n = 44,173, Vulser et al., 2016).
- Lastly, a large study finds suggestively that blood markers for anaemia appear to increase before a diagnosis of depression compared to matched controls (Cheng et al. 2024, n = 502,617)Cheng et al. explains “The findings from our study reveal a significant downward trend in Hb, Hct, and RBC in patients with depression, schizophrenia, and bipolar disorder prior to diagnosis. However, these parameters gradually improved following diagnosis. In patients with anxiety disorders, a similar trend was observed for MCV, HbA1c, and MCH, which also improved post-diagnosis. These results suggest that patients with mental disorders may have some degree of anaemia and iron deficiency prior to their diagnosis.” Giventhe control group based on matching, it seems plausible that the authors could leverage the observed changes in blood iron levels to make causal claims on depressionor anxiety diagnosis, but the authors do not do so. We aren’t sure why, other than this paper seems to have a biochemical rather than a mental health emphasis. .
Evidence of the causal effect of anaemia on wellbeing
We found two studies attempting to control for genetic predispositions which the authors claim allows them to estimate a causal relationship. This methodology is called ‘Mendelian randomization’ (Emdin et al., 2017). Wang et al. (2023) found no (purportedly causal) relationship between anaemia and depression (OR = 1.00, 95% CI = 0.99-1.01, n = 29,391). However, a comment on that article claims they performed a similar analysis on a slightly different sample and found a causal effect of mild and moderate anaemia on depression in general (OR = 1.22). The effect also appeared gendered where anaemia had a large negative wellbeing effect on men (OR = 1.82 for mild anaemia, OR = 2.05 for moderate to severe) but not women (OR = 0.96 for mild, OR = 1.08 for severe) (n = 32,658, Si et al., 2024).
We aren’t sure how to interpret this evidence for several reasons. First, it’s unclear which study is more correct. Second, we’re unsure how to interpret the causal claims made by genetic studies more broadly since the assumptions for causality appear rather difficult to meet (Sanderson et al., 2022). That said, we still try to incorporate this evidence in our estimate of anaemia’s effect on depression.
Synthesising evidence to estimate the effect of anaemia on depression
To predict the effect of anaemia on depression we aggregate and adjust the estimates we’ve discussed in several steps. First, we separately calculate the weighted geometric meanThis is because simple averages can not be applied to odds ratios (Coston and Kennedy, 2022). of the odd ratios in the correlational and Mendelian randomisation studies.
We then apply a subjective 75% discount to the correlational data and our typical 51% replicability discount to the Mendelian Randomisation (MR) papers.
The subjective 75% discount is because we assume a high degree of reverse causality in the correlational studies. This seems plausible because there seem to be many factors driving both distress and anaemia (Reid et al., 2023; Reid et al., 2022).
Finally, we assign equal weight to these averages and once again take the geometric mean arriving at an odds ratio of 1.09 for anaemia and worse depression (in this case 9% higher likelihood of depression). We summarise this aggregation in Table 2 below.
Note that we also found some correlational evidence of the relationship between iron deficiency in childhood and later in life mental health, but think it’s too low quality to useIron deficiency in childhood is potentially related to greater symptoms of poor mental health later in life(n = 1,018, Doom et al., 2018; n = 122, Lozoff et al. 2000; Lozoff et al. 2013; n = 185, Corapci et al., 2009; n = 697, McCarthy et al., 2021). But these studies have several issues that keep me from using them: First, they are less well powered than the concurrent, correlational evidence. Second, most of them are part of the same longitudinal trial mentioned above (Lozoff et al., 2014), which found that iron fortification for healthy children had no effect. We are concerned that some of these papers may be the result of trying to wring every possible paper out of a unique data source. .
We interpret the evidence we’ve discussed above as mostly correlational (given our uncertainty about how to interpret Mendelian randomization). However, altogether we think it's suggestive of a short term causal relationship between anaemia and depression. That is, we think the evidence we reviewed provides some relatively weak evidence that as long as one has anaemia, one will have more symptoms of distress. The reason we interpret the evidence this way is that there appears to be a large amount of evidence finding mostly similar effects, with some studies reporting the dose response relationship we’d expect if the relationship was causal. However the fact that one out of two causal studies suggests exactly zero relationship between anaemia and depression increases our uncertainty quite a bit.
Table 2: estimated odds ratio (OR) across evidence of anaemia
|
Source |
OR |
Log(OR) |
Sample (or weight) |
Study type or source |
|
2.34 |
0.37 |
2,956 |
Observational |
|
|
1.53 |
0.18 |
32,792,378 |
Observational |
|
|
1.53 |
0.18 |
1,876 |
Observational |
|
|
1.43 |
0.16 |
140,000 |
Observational |
|
|
1.00 |
0.00 |
29,391 |
Mendelian Randomization |
|
|
1.22 |
0.09 |
32,568 |
Mendelian Randomization |
|
|
Geometric correlational avg (1) |
1.53 |
Correlational studies |
||
|
Average of MR studies (2) |
1.10 |
Weight for MR studies |
||
|
Discounted (75%) avg OR (1) |
1.132 |
0.5 |
Correlational studies |
|
|
Discounted (49%) avg OR (2) |
1.053 |
0.5 |
Weight for MR studies |
|
|
Geometric avg of averages |
1.09 |
Aggregate effect estimate |
||
|
Effect in Cohen's d |
0.049 |
3. Organisation: Fortify Health
The organisation we review as a charity delivering iron fortification is Fortify Health, an AIM (formerly Charity Entrepreneurship) incubated charity. They focus on supporting mills and encouraging government food programmes to fortify wheat flour with iron. We’ll be focusing on their open market programme which received ~80% of their budget in 2023 (p. 17) and thus represents their focus. They describe their open market programme as:
“Fortify Health partners with millers in various Indian states. We support those millers to fortify the wheat flour they produce with vital micronutrients (iron, folic acid and B12). We provide our mill partners with the equipment, materials and training that they need to fortify their wheat flour in line with standards set by the Food Safety and Standards Authority of India. Our mill partners then sell that fortified flour in the open market.”
Apart from receiving most of the organisation’s resources, we also focus on the open market programme because we were told that it’s harder to understand the impact of Fortify Health’s work with government and quasi-government partners. Basically, we don’t have clear data on the wheat fortified as a result of their non-market partnerships like we do with the open market programme which tracks their partner mills production on a dashboard.
In this analysis, we are not counting the effects (or costs) of their government and quasi-government partnership programmesThey report partnering with at least one state government in 2023. .
Fortify Health's theory of change through their open market programme
Fortify Health supports mills to transition to fortifying wheat flour as a part of their regular production process. In the free market, mills don’t fortify because
- (a) their margins are too tight,
- (b) they don’t have the capacity and technical know-how to implement monitoring systems and ensure they meet the quality assurance and standards for fortification (as per the FSSAI guidelines) and
- (c) there isn’t consumer demand for fortified wheat flour.
Fortify Health solves these problems by:
- (a) covering the full costs of the micronutrient premix and microdoserThe cost of premix is 10-16 paise/kg ($0.0012-0.0019/kg, or $1.20-1.90/MT. The average = $1.56) and the cost of the microdoser is 75,000 - 141,000 INR ($900 to $1,692, average = $1,296). Given that in July 2024, Fortify Health had 90 partnered mills, and produced 21,707 MT that month, we can divine that the production per month per mill is on average 21,707/90 = 241 MT and thus per year is 241 * 12 = 2,894 MT. The average cost to Fortify Health of providing premix for a year to a mill is therefore 2,894 * $1.56 = ~$4,515. needed to fortify wheat with iron,
- (b) providing technical assistance to set up “quality assurance and control systems[…], track premix usage and get samples test[…], conduct iron spot tests on fortified atta [and] get the +F logo and endorsement for fortification” and
- (c) “generat[ing] demand for fortification among their consumers through sales training and marketing funds” and increasing awareness of the importance of fortification.
However, we think that the first two parts of the theory of change (increasing supply) better reflect Fortify Health’s operations than the third (increasing demand) based on their expenditures.
They report the total flour production of their partner mills on a monthly basis. These production figures should capture Fortify Health’s attempt to target both sides of the market by expanding the supply of fortified flour (covering costs and providing technical support) and increasing demand through sales training and marketing funds. What would not be captured in these figures is whatever increase in fortification that comes from increasing demand for wheat provided by mills that Fortify Health does not partner with. We aren’t sure how much potential impact this might be, but assume it’s relatively small.
Tony Senanayake (CEO of Fortify Health) told us that they think they are responsible for more than 90% of the flour their open market partner mills fortify“Webelieve that we are causally responsible for the vast majority of this production (more than 90%). We say this because: We believe that the majority of our current partners would not be producing fortified flour at all without our support- There is limited data on open market production, but we understand that only a small proportion of flour produced in India is fortified. We find anecdotally that very few of the open market mills that we approach are already producing fortified flour.”.
For this initial exploratory cost-effectiveness analysis, we take their claims of causal responsibility at about face value (we apply a 10% discount to account for the possibility that a small amount of millers might have fortified without support). We don’t have any strong reasons for scepticism here. The case for attributing the overwhelming increase in fortification observed in partner mills to Fortify Health strikes us as very plausibleWe’ve found some studies of iron fortification policies that illustrate less potency at scale (Berry et al., 2020; Grafenstein et al., 2023),indicating potential difficulties with implementing programmes to increase iron intake. We don’t incorporate this evidence into the cost-effectiveness analysis since we think that Fortify Health has reasonably strong evidence of compliance. .
Do they have a funding gap? In communication with us, they reported an unfilled funding gap of around $6.5 million for the next three yearsIn 2022 they were given a $8.2 million USD grant by GiveWell to cover 5 years. They report thatin 2023, 98% of their annual expenditures were covered by this grant. However, as they plan to grow they’ll soon outstrip the $1.64 million yearly amount that the GiveWell grant covers (they spent $1.5 million in 2023). A funding gap also seems quite plausible given the scale of the problem that remains unsolved in India. They only serve ~2% of the mills in India at the moment.
Subjective impression of the organisation
We haven’t completed an in-depth analysis of the strength of the organisation (c.f. HLI, 2023). But from our interactions with Fortify Health we’re inclined to think it’s a well functioning organisation based on their ability to considerably scale a technically complex programme in a relatively short period.
Fortify Health has a clear focus on cost-effectiveness and transparency. Their future projects seem promising and they appear to have made reasonable hiring decisions. Lastly, their CEO, Tony Senanayake, has been extremely forthcoming and detailed in response to our questions.
We should also declare a potential conflict of interest here. Both of the founders of Fortify Health (Brendan Eappen and Nikita Patel) were volunteers for HLI in 2018-9 while we were starting up. While we strive to remain impartial, it’s possible this could have affected our analysis.
4. Speculative cost-effectiveness estimate
Based on Fortify Health’s strategy there are two ways to think about their impact. First, we can focus on the flour they fortify in a year. Second, we can focus on their investments to increase future production. In this analysis, we focus on the production in the near term because it’s more consistent with other analyses, more legible and less speculative. But in a later section, we’ll also discuss the potential payoff of the long term investments they are making. We think the investment perspective is an important, potentially relevant, albeit harder to estimate element part of their theory of change.
We discuss our cost-effectiveness estimate in three parts:
- In the first part, we estimate the cost per person provided with a year of fortified flour.
- In the second, we estimate the total wellbeing benefit Fortify Health provides through the two pathways we analyse: the benefits to children of pregnant women and the concurrent effects of iron fortification for the anaemic population.
- In the third, we summarise the cost-effectiveness analysis and discuss its limitations.
4.1 What is the cost to provide a year of fortified flour?
The first step in our analysis is to estimate the cost per person for Fortify Health to supply a year’s worth of fortified flour. However, while we normally choose the most recent year as a proxy for the near-term future, that seems less sensible here. That’s because Fortify Health spends a sizable amount of its yearly budget investing in future capacity.
In 2023 Fortify Health spent 58% of their open market budget on expanding to new mills (private data)The rest of the budget goes to supporting the running costs of providing premix to a mill. Note that we think that if Fortify Health stopped supporting mills, they’d likely stop fortifying because many mills operate on slim margins. . This expenditure is not completely reflected in the output of partner mills in that same year because establishing new partnerships comes with high setup costs.
Indeed, we expect that over time Fortify Health will spend less on the initial fixed costs of setting up mills for fortification, and a higher proportion on upkeep, so their cost-effectiveness will increase over time. The motivation for focusing on future production and costs is further motivated by costs declining considerably in the past two years. Based on data Fortify Health shared with us, costs declined from $40 per metric tonne in 2022 to $7 in 2024. There also still seems to be considerable room for them to utilise further economies of scale Given there are around 5,000 wheat flour mills in Indiaof which Fortify Health have only partnered with 102 so far (~2% of total mills) and in 2023 India produced approximately 112.74 million MTs of wheat flour, meaning Fortify Health only helped fortify 0.13% of total production. . In Section 4.3 we speculate as to what further cost reductions would mean for their future cost-effectiveness.
But the choice of using projections of future production raises the question: how many future years should we project forward to compensate for the fact Fortify Health will be investing a great deal in the near term? We are unsure how to answer this question. Using a figure too near term neglects the value of the investments. But projecting out too far (say, the total lifespan of Fortify Health) risks making the analysis so speculative it’s difficult to understand or communicate how seriously it should be taken.
For our model, we assume that the benefit of funding Fortify Health now is reflected in their average projected output over the next three years. We’re uncertain about this choice of three years. We largely chose it because we think it’s probably about as far as we can reasonably expect Fortify Health to reliably forecast their production and costs. We relegate the longer term aspect of present investments and their effect on cost-effectiveness to Section 4.3.
Wheat production and how many it feeds
According to Fortify Health’s external dashboard the mills they partnered with produced a total of 92,874 metric tonnes between July 2022 and June 2023 (their fiscal year), and 206,287 metric tonnes between July 2023 and June 2024.
Fortify Health predicts that this will continue to increase to 422k, 627k and 936k for the ensuing three year periods. Their scaling forecasts were accurate in the pastWe compare heretheir projected figures (2021) to their achieved figures (2024) and find that their projections tended to be conservative. That is, they did better than expected. , so we use the average production value across these next three years for our analysis, i.e. 665k metric tonnes a year on average.
Now that we have the average annual amount of flour we expect Fortify Health to produce in the near future, we need to derive the number of people fed by each year this amount of fortified flour.
We use data from the national household consumption survey of India (2011-2012). Using this, we estimate that the average daily consumption of wheat flour is 205 grams in the states where Fortify Health worksThis is higher than the national average of 137 grams estimated in Mottaleb et al. (2023), but this doesn’t seem implausible. Indeed, we would expect Fortify Health to target states with higher flour consumption.. Therefore, the amount of people who can be fed for a year with the fortified flour is the total production (in grams) divided by (daily grams of consumption * 365). For the results of this calculation, see Table 4 below.
We adjust these figures based on two considerations. First, Fortify Health estimates that 22% of flour is wasted before being consumedFortify Health estimates that this is 22% (bottom of the page here). This appears like it may be a guess on their part, but even if so their guess is better than ours. . Second, it’s possible that some mills might have fortified anyway. To adjust for this we apply a 10% discount based on taking Fortify Health’s claims regarding their attribution at face value.
Applying both these adjustments allows us to estimate the total amount of fortified wheat flour consumed which Fortify Health is responsible for. We show, after adjustments, the amount of people Fortify Health feeds with fortified flour in recent and the next three years in Table 4 below.
Table 4: How many people does Fortify Health feed for a year 2022-2027
|
Time period |
July 22 - June 23 |
July 23 - June 24 |
July 24 - June 25 |
July 25 - June 26 |
July 26 - June 27 |
|
Forecasted or Historical |
Historical |
Historical |
Forecasted |
Forecasted |
Forecasted |
|
Total consumed, adjusted for wastage (MT) |
65,197 |
144,813 |
296,058 |
447,350 |
657,177 |
|
Daily wheat flour intake based on FH states (g) |
205g |
205g |
205g |
205g |
205g |
|
People fed for one year |
873,334 |
1,939,807 |
3,965,764 |
5,992,349 |
8,803,040 |
We show the expenditures for Fortify Health’s open market programme below.
Table 5: Costs for the open market programme
|
Time period |
July 22 - June 23 |
July 23 - June 24 |
July 24 - June 25 |
July 25 - June 26 |
July 26 - June 27 |
|
Forecasted or Historical |
Historical |
Historical |
Forecasted |
Forecasted |
Forecasted |
|
Total cost (w/ discount) |
$1,051,001 |
$1,393,641 |
$2,558,512 |
$3,211,238 |
$3,785,980 |
|
Cost per MT |
$11.32 |
$6.76 |
$8.67 |
$7.20 |
$5.78 |
Note that there is a jump in costs from the period July 2023 to June 2024, to July 2024-June 2025. Fortify Health explained this is because they have plans to:
- Expand their team and operations significantly in 2024/25.
- Enter new states, which requires up-front investments.
- Invest more in research and development, which does not have immediate payoffs.
In the long-run we expect these are reasonable strategic decisions which improve our qualitative opinion of Fortify Health, even if that is not reflected in our estimate of the near-term cost effectiveness.
Fortify Health has also shared with us that costs have historically been 30% below budget. We assume this trend will continue, thus correcting the cost projections with a 30% discount.
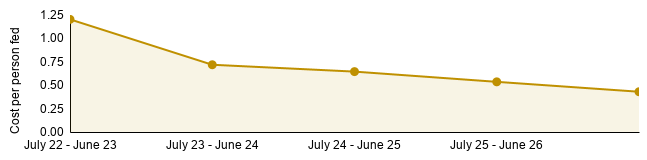
Cost per person
To arrive at the cost per person treated we divide the total costs by the number of people fed for a year. Averaging the cost per person affected over the next three years leads us to a cost of $0.54 per person-year of fortified wheat provided. We show this calculation in Table 6 below, which is based on the calculations provided in the previous two tables.
Table 6: Average cost per person-year of fortified wheat flour provided
|
Fiscal Year |
2024 to 2025 |
2025 to 2026 |
2026 to 2027 |
|
Total forecasted costs |
$2,558,512 |
$3,211,238 |
$3,785,980 |
|
People fed for one year |
3,965,764 |
5,992,349 |
8,803,040 |
|
Cost per person fed for a year |
$0.65 |
$0.54 |
$0.43 |
|
Average across next 3 years |
$0.54 |
||
In Figures 4 and 5 below we show the cost of all these factors we discussed over time.
Figure 4: People provided with wheat for a year, total costs
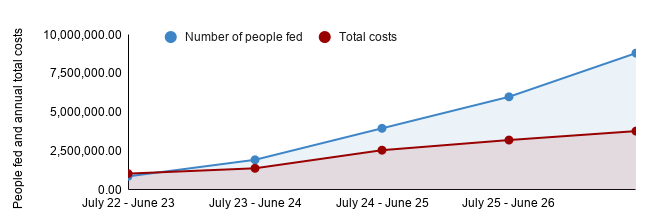
Figure 5: Cost per person fed for a year with fortified wheat flour
4.2 The wellbeing benefit of fortified wheat flour
We consider two pathways through which iron fortified wheat flour impacts wellbeing.
- Through the short run effect on anaemia
- Through the effect on pregnant women’s children.
We estimate these separately.
4.2.1 The concurrent benefits of iron fortification on the anaemic population
Our estimate the short term benefits of consuming iron fortified flour based on multiplying together two estimates:
- First, that curing anaemia for a year leads to a 0.05 SD improvement in depression symptoms lasting a year, or a 0.10 WELLBY improvementAs per our general approach, we convert SD-years (e.g., a 0.2 SD effect lasting 10 years is 0.2 * 10 = 2 SD-years) to WELLBYs (e.g., points on a 0 to 10 wellbeing scale) based on a conversion factor of 2 – where the 2 represents the global average SD of life-satisfaction (see Dupret et la., 2024for more details). . This is based on the discounted estimates (49-75%) from the correlational and Mendelian randomization studies mentioned above.
- Second, the effect of consuming iron fortified wheat flour on anaemia will lead to a 14% decrease in anaemia. This is based on Fields et al., (2021) which we discounted by 49% for general replicability concerns.
The per-person wellbeing effect per year is therefore assessed at 0.1 WELLBYs (effect of curing anaemia) x 0.14 (reduction in anaemia from fortification) = 0.013 WELLBYs.
We only apply this effect to those with anaemiaThis is a binary distinction. But it’s possible that iron could benefit those who are iron deficient but not-anaemic. These individuals are not counted in this analysis. . However, we estimate that a large amount of the population in India is anaemic. Natekar et al., (2022) estimate that 53% of adult women in India have anaemia. Saxena and Singh estimate that this is 25% for men in India (2023). We use the latest data from Our World in Data (2019) for the rate of Anaemia in children under 5 in India (51%). Then, using the proportion of children under 5 in India (8%) from UNICEF (2023) and assuming an equal proportion of men and women, we estimate that the average rate of anaemia in the general population is 40.1%.
To get the total wellbeing benefits Fortify Health provides though this channel we multiply the WELLBY effect per anaemic person provided with iron fortified wheat for a year with the per anaemic WELLBY effect. In other words applying the effect per anaemic fed for a year, which is 0.01 WELLBYs, to the approximately 2.5 million people with anaemia Fortify Health will feed in the typical upcoming year. This results in a total of 34k WELLBYs produced. See Table 7 below for our calculations.
Table 7: Short run wellbeing effect of reducing anaemia with iron fortification
|
Time |
Avg next 3-yrs |
|
OR of anaemia to depression |
1.09 |
|
Effect in Cohen's d of above OR |
0.05 |
|
WELLBY burden of year with anaemia |
0.10 |
|
Reduction in anaemia from fortified bread |
0.14 |
|
WELLBY effect per year of iron bread for anaemics |
0.01 |
|
Proportion of targeted population with anaemia |
0.40 |
|
Number of people fed for a year |
6,253,717.54 |
|
Number of anaemic people fed |
2,508,649 |
|
Total WELLBY effect for anaemia reduced through FH |
33,853 |
4.2.2 Long run benefits of iron on the children of pregnant women
The second pathway we use to estimate the benefits of iron fortification is through the children of pregnant women who may develop better as a result.
We start with the 3 WELLBY result per person whose mother received supplementation in utero as implied by Zhu et al. (2023). We then apply internal and external validity adjustments to these results to make them more reliable and appropriate when applied in the context of iron fortification. Together, these adjustments result in a decline in the 3 WELLBY effect by 86% to 0.4 WELLBYs.
The first element of the adjustment, the internal validity correction, comes from assuming that the effects will be 51% smaller if replicated, based on the general replicability in social science reported by Nosek et al., (2022).
The second adjustment comes from generalizability concerns. Zhu et al. (2023) studied the effects of iron supplementation, which has a much higher daily dose of iron (60mg in Zhu et al.) compared to the 4 mg dailyThe government regulates that for a one kilogram of flour, it should have between 14 and 21mg (median of 18) of iron per kilogram (Taken from FSSAI). Converting the units, this means 0.02 grams per gram of flour or a daily iron intake of 3.7 per person per day (see sheet for calculations). This comes from an estimate that average daily wheat flour consumption in the states Fortify Health operates in is 205 grams, and that there is 0.02 mgs of iron per gram of flour (see sheet for calculations). for those consuming fortified flour.
To account for this difference we attempt to guesstimate a dose-response relationship between iron and wellbeing based on the iron-anaemia relationship. We do this by using two meta-analyses with data on the daily dosage of iron provided and their effect on anaemia. Using this data, we compare the relative differences in their dosage and their effects on anaemia. The results from these two studies are shown below in Table 8. The takeaway is that the relationship is implied to be concave based on the fact that the dose in Field et al. was 35% smaller than in Low et al. but had only had an effect 54% as small.
Table 8: The dose-response relationship between iron, anaemia, and wellbeing
|
Parameter |
mg per day |
anaemia reduction |
|
Daily iron mg in Field et al. 2021 (fortification) |
10 |
27.00% |
|
Daily iron mg from Low et al. 2013 (supplementation) |
28 |
50.00% |
|
Linear ratio |
0.35 |
0.54 |
To extrapolate from these cases, we have to choose which functional form best fits this relationship. We think the functional form is better approximated by a square root rather than a logarithmic relationship. We take this to be the case because the square-root adjustment (sqrt(10)/sqrt(28) = 0.59) comes closer to the linear (0.35) or logarithmic (0.69) adjustments in matching the data (0.54 adjustment). However, this is an estimate that could be further refined with more time.
Our major assumption is that iron’s effect on wellbeing has a similar dose-relationship to the effect of iron on anaemia. However, this is consistent with our assumption that the wellbeing benefits of iron exposure largely flow through reductions in anaemia.
Another factor that could affect the generalisability is the difference in anaemia rates between the evidence and implementation contexts. We think the anaemia rates differ between study and implementation contextsIn Zhu et al. (2023) only 37.6% of the pregnant women studied were anaemic. In comparison in India 52% of pregnant women are anaemic (Dutta et al., 2023).. However, while we think it’s plausible this matters, we don’t adjust for this factor since there isn’t any evidence regarding whether those with anaemia are driving the effects.
The difference in dosages between study (60 mg) and implementation (4 mg) imply a total generalisability adjustment of sqrt(4) / sqrt(60) = 0.25, a large (~75%) discount.Combining the internal validity (51% for replication) and generalisability adjustment (25% for dosage) results in a: 0.51 * 0.25 =0.13 total adjustment or an 87% discount. When applied to the estimated 3 WELLBY effect stemming from those affected by higher iron levels in utero, this means a 3 * 0.13 =0.4 WELLBY effect per pregnant woman provided with fortified wheat flour.
The number of women in India who give lives births makes up 1.7% of the population of India in a given yearThis comes from dividing the number of births in India in a year (25 million,UNICEF), by the total population of India (OWID, prediction for 2025). . We assume that a similar proportion of the people served by Fortify Health will receive the benefits (68k of around the 6 million projected to be served in the 2025 to 2026 period). Applying the 0.4 per pregnancy WELLBY effect to this population leads us to the 41k WELLBY effect overall. We show the calculated wellbeing benefits for the children of pregnant women affected by fortified wheat flour below in Table 9.
Table 9: Estimated effectiveness for the children of pregnant women fortified
|
Effects on children of pregnant women |
Avg next 3-yrs |
|
Daily iron from wheat intake for those exposed to fortified atta (mg) |
3.71 |
|
Share of population pregnant in a given year |
1.71% |
|
Number of pregnant women served by FH |
67,907 |
|
WELLBYs per pregnant woman supplemented with 60 mg |
2.99 |
|
Adjustment generalisability |
0.25 |
|
Replicability adjustment |
0.51 |
|
WELLBYs per pregnancy (adjusted for dose and bias) |
0.38 |
|
Total WELLBYs for LR effects for children of pregnant women |
40,620 |
4.3 Total cost-effectiveness of Fortify Health
In the previous sections, we explained our estimates for the total cost and total effect of funding Fortify Health’s open market programme for a year. To estimate the cost-effectiveness we simply take the ratio of the two and multiply this by $1,000. The result is our estimate of the WELLBYs generated per $1,000 donated to Fortify Health and directed to its open market programme.
We calculate the cost-effectiveness (shown in Table 10 below) averaged over the next three years (2025-2027) to be 22 WBp1k. We estimate that about half of this benefit comes from the average short term benefit to the population that is anaemic with the other half coming from effects on children in utero.
Even though the cost-effectiveness estimate is only ~3x GiveDirectly cash transfers (see McGuire et al., 2021) across the next three years, it seems plausible that this will increase further over time – a topic we turn to next.
Table 10: Cost-effectiveness estimate of Fortify Health
|
Summary of total effects |
Avg next 3-yrs |
|
Total WELLBYs from concurrent anaemia benefits |
33,853.21 |
|
Total WELLBYs from in-utero exposure |
40,619.51 |
|
Total WELLBYs produced |
74,472.72 |
|
Total Expenditure |
3,185,243.55 |
|
Total WBp1k (including pregnancy effects) |
22.79 |
|
Adjustment for negative effects on healthy |
0.95 |
|
Adjusted Total WBp1k |
21.65 |
Note: We adjust for potential harms of iron exposure in the general population, which we think there is some weak evidence forGahagan et al. (2019) and East et al. (2022) provide some weak evidence that initially healthy children receiving higher levels of iron supplementation (12 mg/L versus 2.3 mg/L) in infancy had lower maths and reading scores 16 years later (n = 405). McMillen et al. (2022) reviews studies that demonstrate negative side effects of iron supplementation to healthy individuals.. We make a small subjective adjustment representing a 5% discount to speculatively address this.
4.3.1 How much could the cost-effectiveness increase over time?
We expect Fortify Health to increase its cost-effectiveness over time. In this section, we estimate the upper bound we think cost-effectiveness could reach as it scales, conditional on our effect estimates remaining the same.
The basic idea behind Fortify Health’s increasing cost-effectiveness is that it’s cheaper to support existing partner mills than to expand to new ones. Expanding to new mills requires large one-time costs. After scaling, Fortify Health will spend relatively less on expanding to new mills.
In 2023 Fortify Health spent $1,156k expanding to new mills and supporting existing mills. Of this, $668k (58%) was spent on expansion versus $488k (42%) on supporting existing mills. However, the new partner mills only increased total fortified wheat output by 28%. So the new mills accounted for 2/3rds of the annual expenses but only provided around 1/3rd of the total output.
If Fortify Health had only focused on supporting existing mills in 2023, then the decline in output (38%) would have been more than made up for by the decreased costs (58%). The ensuing cost-effectiveness would have been about 70% higher in 2023. This doesn’t imply that investing in expansion is a waste. If Fortify Health adds new partners at a constant rate (which is consistent with past data), this means that over time a larger share of production will be through existing mills (which is cheaper). So as they scale they will reduce the cost per tonne of flour fortified and increase the cost-effectiveness.
But what would this future cost-effectiveness at scale be? One way to make that prediction is to assume that the same increase in cost-effectiveness that came from focusing only on existing mills (1.7x) will apply to the cost-effectiveness we estimated in the previous section (22 WBp1k). This would imply that Fortify Health could provide 39 WBp1k at its maximum scale – when they no longer invest in new mill partnerships.
However, we suspect the upper bound might be higher than this as there are probably some additional economies of scale to realise. We expect Fortify Health will continue to achieve economies of scale as its scale grows, such as through spreading the cost of essential employees over a greater output. It’s unclear how much this would result in cost reductions, but we can estimate an upper bound of the cost-effectiveness by using the cost per metric tonne of the pre-mix of iron ($1.56, or ~$0.17 per person fed for a year) that’s to be combined with the flour.
The pre-mix seems like the minimum viable input to keep the mills fortifying. If the only cost for Fortify Health was buying the pre-mix, and this was enough to keep the mills fortifying, then this would decrease costs by about 70% and increase the cost-effectiveness to around 68 WBp1k. This is an unrealistically optimistic depiction of the lower bound of their potential cost per tonne fortified because it assumes no salaries, technical assistance, or other necessary functions. Thus, we would be surprised if the cost-effectiveness would surpass 68 WBp1k with our current effect estimates.
4.3.2 Key consideration and uncertainties to our analysis
It’s important to note that we assign no benefit to several possible pathways for fortified flour to benefit wellbeing, so the cost-effectiveness could be higher than we estimate here. The pathways we don’t include are:
- The long run effect of reducing anaemia for children, which we think is often assumed, but we didn’t find enough strong evidence to support it. Given that we assumed the effects of the other nutritional intervention we reviewed (e.g., CMAM by Taimaka) were entirely due to long-term developmental effects, we think it’s worth considering revisiting this in the future.
- The effects of Fortify Health’s governmental and quasi-governmental partnership programme (they spent 23% of their budget on these programmes in 2023). Equally, we do not include the money spent on this program in our calculation. This could move the cost-effectiveness in either direction. If we assume it is completely ineffective then cost-effectiveness would presumably be decreased by 1 - 1/(1 + 0.23) = 18.7%.
- Any benefit that accrues to those with iron deficiency but not anaemia.
- We also assign no benefit to the investments that Fortify Health will make as part of their costs in the period we analyse from 2025 to 2027. To explain, their investments likely increase Fortify Health’s cost-effectiveness, which could itself be cost-effective. But we are unsure how to count this, so we omit this factor at present.
Our biggest uncertainty with this analysis is our causal interpretation of the correlational literature between anaemia and depression. Improving our confidence in this link would be our highest priority with more time as it could significantly shift results.
5. Confidence
5.1 Quality of evidence
We provide our assessment of evidence based on the widely-used GRADE (Grading of Recommendations, Assessment, Development and Evaluation) framework, as we explain on our website. See this article for a brief overview.
We rate the evidence quality as low. For an explanation of what high-moderate-low grading means, see the footnoteHigh: To be rated as high, an evidence source would have multiple relevant, low risk of bias, high-powered RCTs that consistently demonstrate effectiveness and have little to no signs of publication bias.
Moderate: If the evidence source moderately deviates on some of the criteria above, it would be downgraded to moderate. For example, if it has some moderate issues of risk of bias, publication evidence from a single well-conducted RCT, or evidence from multiple well-designed but non-randomised studies that consistently demonstrate effectiveness.
Low: If the evidence deviates more severely on these criteria it could be downgraded to low. For example, if it does not use causal studies (pre-post, correlations, etc.).
Very low: If the evidence deviates even more severely on these criteria, or is low on many criteria, it can be downgraded to very low.. We’ll now explain, via the components of GRADE, why we rated the evidence available here as low.
Study design: The evidence we draw on relies in considerable part on studies without a causal identification strategy or Mendelian randomization studies, the latter of which is a design whose strength we’re unsure of both in general and in this particular case.
Risk of bias: We haven’t performed a risk of bias analysis, but expect that if we did we’d suspect the risk of bias would be relatively high for the evidence we use.
Imprecision: Many of the correlational studies we use have relatively precisely measured effects because of their large samples. However, on a few notable occasions the evidence we use produces estimates with imprecisely measured effect sizes. For instance, Zhu et al. which we use for the effect on children of pregnant women are only statistically significant at p > 0.1. Furthermore, some of the Mendelian randomization studies find null effects.
Inconsistency: While many of the correlational depression-anaemia estimates agree – the mendelian randomization studies diverge, introducing a notable source of inconsistency in the evidence.
Indirectness: The evidence we use is relatively indirect. We have no direct evidence of iron fortification on wellbeing. Instead of relying on direct causal evidence, we have to extrapolate from other sources of evidence.
Publication bias: We did not assess publication bias in this analysis. It’s also not possible for small study sizes. In the absence of evidence against publication bias, we tend to assume the worst.
For the reasons we outlined above, particularly the high degree of indirectness, and lack of causal evidence we rate the evidence quality as low.
5.2 Depth of analysis
We rate the depth of work that went into creating this estimate as low. By this we mean that we believe we have only reviewed some of the relevant available evidence on the topic, and we have completed only some (10-60%) of the analyses we think are useful. We would guess there is more evidence and analysis that could be applied but we are not sure what it would be. Another way of expressing this is that we view this report as shallow. For example, the first author put ~80 hours into this report – our most in-depth reports might have absorbed 10 times as much time.
6. Conclusion
We estimate that Fortify Health’s cost-effectiveness is ~22 WBp1k. This is roughly 3x more cost-effective than our benchmark of GiveDirectly cash transfers (7.5 WBp1k. We think it’s plausible that Fortify Health’s cost-effectiveness could increase over time, up to 39 to 68 WBp1k – but this is an educated guess.
We compare the cost-effectiveness of Fortify Health to other charities on our web page here. Note that our assessment of Fortify Health is far more speculative than it is for other areas and interventions, where there is a lot of direct RCT evidence to draw on.
On the organisational side we hold a positive view of Fortify Health. We are reasonably convinced by their theory of change. Generally, they seem to be a well functioning organisation that’s already scaled a complex technical enterprise while maintaining the quality of their operation. However we spent little time qualitatively evaluating the strength of their organisation, so our views are relatively weakly held.
Our conclusion relies on some thin evidence (1 RCT of the long-term wellbeing effects of in-utero exposure) and some speculative assumptions about several key parameters. Our analysis is also particularly sensitive to a few assumptions. The first assumption is the form of the dose-response relationship between daily iron intake and wellbeing (which we assume is concave). The second assumption is the causal relationship between anaemia → depression. As such, we recognize these estimates could move around substantially with more research time. That’s the nature of preliminary results. However, we still think it’s useful to share and discuss these results.
Given our uncertainty, we think it would be valuable to collect further causal evidence on the wellbeing effects of iron fortification. We think the best options would be to add wellbeing measures to any follow-ups of large iron fortification RCTs or to find a natural experiment that allows comparing the wellbeing effects of exposure to iron fortification as a child. We discuss these options in more depth in Appendix C.
Appendices
Appendix A: Search strategy and literature review
There is an immense amount of research on nutrition’s effects and relationship to health. We tried to be reasonably exhaustive, but we consider this a rather quick and shallow review that potentially missed important papers.
In this section, we discuss:
- Our general search strategy for finding nutritional interventions and organisations.
- Interventions we don’t explore in depth (for various reasons).
A1. Search strategy for evidence
For the evidence review, we used a non-systematic search strategy, which we explain here.
We used Elicit and Google Scholar to look for meta-analyses, reviews of childhood development interventions, and specific studies of the long term causal effects of a nutritional intervention. For example, we searched through the citations listed in “The Effect of Malnutrition and Micronutrient Deficiency on Children’s Mental Health” by Grantham-McGregor and Smith (2020) – which seemed like it should have any important articles on the topic because it was a review involving prominent researchers in the field. In general, we searched through the description of each article included in the review to see if it included MHa or SWB outcomes. We did not look through full articles but used summary information taken from abstracts. It’s possible that we missed some studies doing this.
We then, using Google Scholar, searched for articles that cited these reviews (like Grantham-McGregor and Smith (2020), and looked through the titles to see whether they clearly included MHa or SWB outcomes. We also searched for individual RCTs or natural experiments and followed a similar search strategy. When we found a study that held MHa or SWB as a primary outcome, we looked through the studies it cited, and the studies that cited it using Google Scholar.
The evidence we reference here is very likely inexhaustive. More studies could likely be collected and they could potentially shift our conclusions.
We spent 10-15 hours searching for studies. We stopped when we felt reasonably confident we had relatively exhausted the sources we could find with a non-systematic search.
A2. Search strategy for finding organisations
We didn’t have an organised or systematic search strategy for organisations delivering nutritional interventions. We pursued a combination of the following:
- Word of mouth. We asked for references to organisations that seemed promising from other researchers or grantmakers working in the effective giving or broader global health and wellbeing space. For example, this is how we came across Taimaka, which we evaluate in a shallow manner.
- Looking for organisations already mentioned in existing reviews of nutrition interventions such as those published by GiveWell.
- Previous knowledge: we were already aware of Fortify Health, which is also a GiveWell grantee.
- Searching for organisations delivering a promising intervention. This was mostly done with Google, which was generally fruitless given how very large charities dominate the search engine optimisation (SEO) algorithms for broad nutrition interventions addressing malnutrition.
Next, we’ll discuss some of the topics we found no evidence on, before moving on to the intervention’s we think were most promising to explore.
Appendix B: The file drawer
There are several interventions we considered looking at relating to nutrition, but did not pursue for one reason or another. This is the proverbial ‘file drawer’. We didn’t investigate these on this occasion due to them being unpromising and a lack of staff capacity. In general, this was due to some combination of:
- The intervention focused on reducing mortality
- We found no wellbeing evidence (i.e., no studies).
- There is evidence but it found null wellbeing effects.
- There are only short term wellbeing benefits and it doesn’t seem cost-effective based on existing evidence.
We list some specific file drawer options below.
Interventions with primarily mortality effects
Nutrition interventions are often assumed to increase wellbeing through saving lives, but this is beyond the focus of our project to investigate in-depth, and not a primary focus of HLI more generally.
Take Vitamin-A supplementation. GiveWell, using the meta-analytic effects on childhood mortality, finds that as it’s delivered by Helen Keller International it’s more cost-effective than the anti-malaria bed nets provided by AMF. Given that if one places a high value on saving lives and AMF is already amongst one of the most cost-effective ways to increase wellbeing, then Vitamin-A provision is at least as cost-effective as AMF, if not more.
Interventions with only short term effects on SWB
In our general evidence exploration, we came across two nutritional interventions that only provided short term evidence of a benefit. The studies also didn’t strike us as constituting particularly strong evidence or indicating a cost-effective intervention if we took the evidence seriously. These interventions are:
- Micronutrient supplementation: 1 RCT from mainland China (n = 2,730), 1 RCT in India (n = 347)
- Nutritional school lunch subsidy: 1 RCT from mainland China (n = 4,397).
Micronutrient supplementation with multi-vitamins may have at least short term effects on mental wellbeing. Zhang et al. (2013) analysed the effects of providing multivitamins (see Supplemental 1 for content) to children aged 10-12 with a high level of anaemia at baseline (42.4%) for a year (n = 2,730). They find a small (0.13 SD) effect on anxietyThe anxiety test involved covers many domains related to learning and social situations (see supplement 1) and doesn’t appear primarily focused on general anxiety. But the authors seem to think it covers general anxiety: “from the General Anxiety Test developed by Kiyoshi Suzuki in Japan (38). These tests are variations of the Children's Manifest Anxiety Scale, which is an internationally standardised test for anxiety in children that has been widely used in the United States and other developed countries (39)”. after the intervention ends (no long-term effects).
They report nearly perfect compliance, which probably doesn’t generalise. After searching Google, we would guess the cost of multivitamin supplementation is around $10-$20 per person for a year. We assume in this circumstance that supplementation needs to be continued for effects to persist. In this case the cost-effectiveness would be between 7 and 14 WBp1k if we apply a standard 51% replication discount to the effect size. This does not appear a particularly promising cost-effectiveness so, in concert with finding no promising organisations focusing on micronutrient supplementation we did not explore this option further.
Satyanarayana et al. (2024) found an effect of vitamin-D supplementation on depression for adolescents in India, but it’s a relatively small sample (n = 347), and so we do not update much on it.
School lunch subsidies may have at least a short term effect on wellbeing. Luo et al. (2019) find a small (0.081 SD) short-term effect (no long term follow-up) of a ~$64 subsidy for school lunches. Based on a brief BOTECConverting the 0.08 SD effect to WELLBYs implies the intervention creates 0.08 * 2 = 0.16 WELLBYs. Using our typical assumptions for 16% spillover of mental health effects and a non-recipient household size of 3, we estimate this would produce 0.16 WELLBYs + (0.16 WELLBYs * 16% * 3) = 0.24 WELLBYs in total. Which at face value would mean 0.24 * (1000/64) = 3.7 WBp1k. If we also applied a 50% replicability discount, this moves the CE down to ~2 WBp1k. we found that this would imply a low cost-effectiveness of around 2 WBp1k, so we didn’t pursue this line of research further.
Interventions and events with null effects
We found quite a few interventions with no statistically detectable effect, which we mention for completeness. It’s unclear whether this is due to no true effect or there being insufficient statistical power (and the effect is just small).
- Exposure to iodine supplementation in utero has no effect on the likelihood of being diagnosed with a mental disorderTable 5, page 13, the effect was –0.0001 (0.0005) with n = 1,246,242. Since FP has a cause area reporton education where they recommend funding charities that provide salt iodisation, this is confusing. It’s a puzzle if salt iodisation increases schooling and schooling is good. One possibility is just that it increases likelihood of non-mood disorders, but decreases likelihood of mood disorders, but that seems unlikely. The estimates are very precise around zero. Additionally, diagnosis of mental health disorders might be too stringent and coarse an outcome compared to increases in symptoms. (Araujo et al. 2021).
- Banerjee et al. (2018) found null short term MH effects of iron-fortified salts to treat anaemia (a supplement recommended by evidence action). The estimates also had mixed signs across models and specifications, so it is probably not cost-effective even if we took the imprecise effect sizes seriously.
- DiGirolamo et al. (2010) studied the effects of a 6-month RCT of zinc implementation on mental health and found no consistent treatment effect (n = 674). They found an association between zinc concentration and depressive symptoms in one specification but we’re inclined to treat this as noise. For similar interventions there are mixed effects on developmental outcomes from Cochrane analyses (Gogia et al., 2012; Imdad et al., 2023) – so it’s not clear that we should have a prior of efficacy in the first place.
- Exposure to fasting while in utero, due to Ramadan fasting has mixed effects on SWB and MHa. Kim (2014), studied 36 year olds in Indonesia and found small effects on height and weight, large negative effects on income (-11.4%) and education (-3.8%) but null effects of fasting on childhood mental health or subjective wellbeingPage 37: “The vast majority of coefficients are not statistically significant, with three being marginally significant and two being significant at the 5% level of significance. However, all five of these coefficients are not in the expected direction and are scattered across the regressions for four different measures. Again, as we are estimating 30 coefficients, we would expect to see one to two coefficients reach the 5% level of significance and three coefficients reach the 10% level of significance through chance alone. The results here are in line with the significance of the coefficients being generated randomly, and do not show any systematic patterns.”. Almond and Mazumder (2011) found that exposure to fasting in utero during Ramadan in Uganda led to a relatively higher likelihood of having a mental or learning disability as an adult at age 58Note that this is outside of normal inclusion criteria which is concerned with self-reports of people’s mental wellbeing and aspects of mental health directly related to mood. . Chen (2017) finds negative effects of exposure to fasting whilst in utero on life satisfaction on 40 year olds. We did a meta-analysis of these studies and found the average effects of Ramadan fasting are non-significant and close to zero after 50-60 years (-0.01, 95% CI: -0.04, 0.01).
Interventions with no direct wellbeing evidence
This is a bit of an empty category, as it depends on us searching for wellbeing evidence for specific interventions. We found no directly relevant evidence (after ~7 hours of searching) for two well-studied ways to address malnutrition:
- Ready-to-Use Therapeutic Food (RUTF)
- Small quantity lipid-based nutrient supplements (SQ-LNS).
But while we found no direct evidence of wellbeing evidence related to these interventions we found enough related evidence (discussed next) to investigate interventions involving RUTF or SQ-LNS in more depth.
Appendix C: Research opportunities
There’s quite a few outstanding questions regarding the relationship between iron fortification and wellbeing.
- First, it would be helpful to have more direct causal evidence on the short (or long) term effects of iron fortification and wellbeing. This could potentially come from potential natural experiments relating to sudden changes in the iron status of wheat in flour in the general population. This could be due to laws mandating the (e.g., Osler et al., 1999), but this would require a regular and relatively granular survey of SWB in the population.
- Similarly, and potentially easier to perform, would be to analyse the later life effects of early life exposure by comparing the wellbeing of individuals who were too young or old to be exposed to fortified flour at a very early age (0 to 5). If the appropriate shock exists then a survey could be delivered to these individuals. If Fortify Health changes the composition of flour enough in a given region, then this design could potentially be applied to Fortify Health itself, which would be ideal for its evaluation. An alternative in the same vein is to follow-up large RCTs like Krämer et al. (2021, n = 1,406) and study the wellbeing long-term effects.
- Second and more broadly, we think it would be useful to have more systematic reviews and meta-analyses of:
- The causal effect of iron or anaemia on mental wellbeing outcomes. For example by meta-analysing the studies in Avery et al. (2020).
- The long term relationship (assuming there’s no long term causal evidence) between iron intake and later wellbeing – particularly between early in life iron intake and later in life wellbeing.
- This is because we have the impression that the evidence tends to be a bit more distributed across fields for this topic than has been the case for other interventions we’ve reviewed.
We also discuss some more general in nutrition research questions in Appendix E of our report on community management of acute malnutrition.