The Happier Lives Institute’s public response to The Unjournal’s evaluation of our psychotherapy report
The Unjournal has provided a very positive peer review of the Happier Lives Institute’s psychotherapy report “The wellbeing cost-effectiveness of StrongMinds and Friendship Bench: Combining a systematic review and meta-analysis with charity-related data (Nov 2024 Update)”. We present our public response.
The Unjournal provides independent peer reviews of research related to global priorities. The Unjournal has provided peer review of the Happier Lives Institute’s psychotherapy report “The wellbeing cost-effectiveness of StrongMinds and Friendship Bench: Combining a systematic review and meta-analysis with charity-related data (Nov 2024 Update)” (McGuire et al., 2024b).
The review was conducted by two anonymous evaluators. The Unjournal’s reviews is in three parts: (1) a summary of the evaluators’ comments, (2) Evaluator 1’s full comments, (3) Evaluator’s 2 full comments.
- Our main takeaways
- Major replies to evaluators
- Minor replies to evaluators
In this document, we provide our public response to the evaluation. We do not reproduce the original paper, or the Unjournal’s evaluation, so readers unfamiliar with those may lack relevant context. Our public response is in three parts:
1. Our main takeaways
This is a very positive review of our work. The reviewers were each asked to (1) give an overall score of 0-100 for the paper, and (2) provide a 0-5 journal tier rank (i.e., what quality of journal it should be published in). We reproduced those scores below:
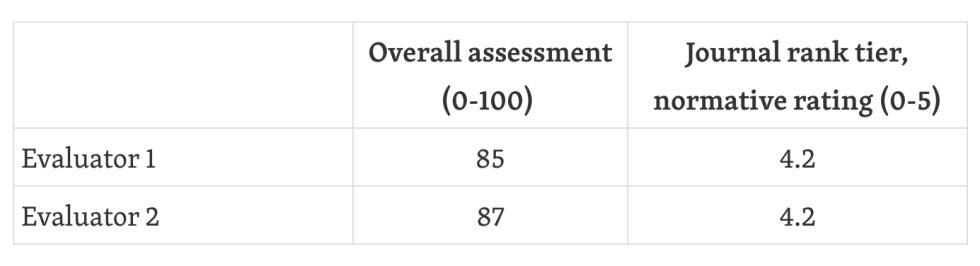
For reference, on the journal rank tier, 4/5 refers to “Marginal A-Journal/Top field journal” and 5/5 is “A-journal/Top journal”.
Using data from The Unjournal, we plot where our report lands amidst other reviews published so far by The Unjournal (16/06/2025). We seem to be slightly right of average, which is notable given we expect the other papers were already selected for being potentially high in quality and importance.
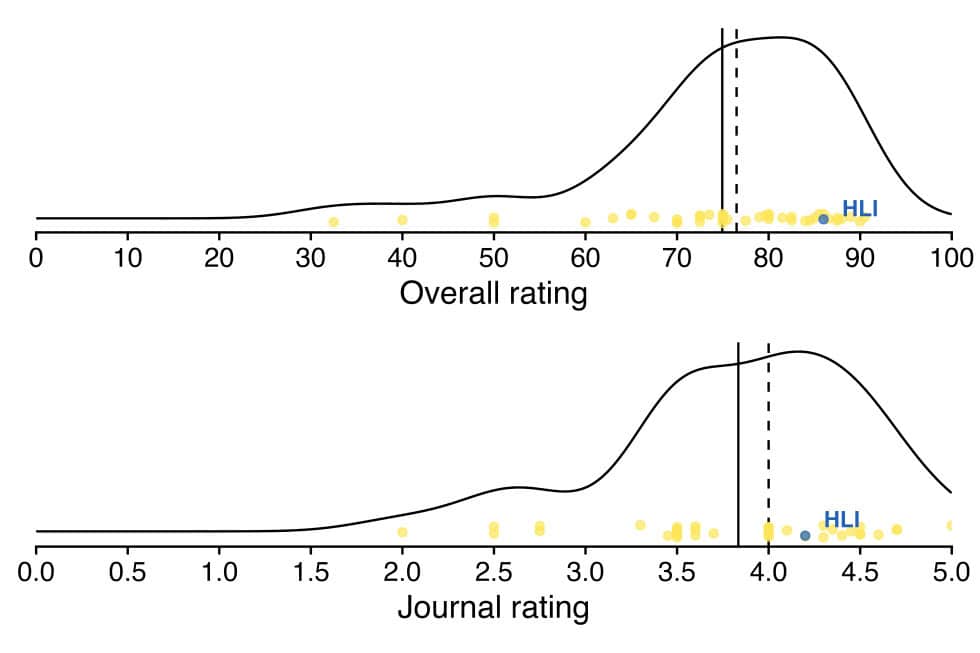
Note. The results are averaged across the two evaluators. The vertical jitter in the dots is just to help with readability. The dashed vertical lines represent medians. The solid vertical lines represent the means. The blue dot represents our evaluation.
Besides being happy with the result, we are also very grateful to the editors and evaluators for the thorough review process and their capacity to undertake this review. The work they evaluated ran to 250 A4 pages, including appendices, and consisted in a literature review, a meta-analysis, and two charity evaluations. In effect, this was akin to reviewing 2-4 academic papers in one go, something that is far outside the scope of conventional academic journals, thus showing the distinctive utility of the Unjournal.
We should mention we are currently working with collaborators to publish our literature review and meta-analysis in academia. Hopefully, we can also publish cost-effectiveness work in academia as well. We have recently published a review of wellbeing cost-effectiveness research in the World Happiness Report.
2. Major replies to evaluators
We had the opportunity to respond privately to the evaluators first before making this public response. Evaluator 1 provided some extra clarification information for which we are very grateful. Evaluator 2 did not wish to reply to our internal response. We respect this, but Evaluation 2 contained elements that we believe might misrepresent our analysis (which we discuss in this section).
About subjectivity and analysis decisions in cost-effectiveness research
There are multiple elements of language in the evaluation that make it appear like our analytical decisions were subjective, in a way that suggests this subjectivity was avoidable and/or objectionable, e.g. : “[…] somewhat arbitrary analytical choices. I discuss some of these subjective decisions […]”; “[…ad hoc adjustments]”; “[subjective decisions and literature quality]”.
Subjectivity is unavoidable in the type of work being evaluated. In any social science project, one must make analytical decisions such as which statistical model to use and how to treat certain data.
And the problem is even worse with cost-effectiveness analyses (CEAs), which inherently involve numerous methodological and normative choices, with much less pre-existing academic consensus, leading inevitably to a degree of subjectivity.
It is fairly common for charity evaluators to make subjective adjustments such as “10% (subjective guess) adjustment here for xyz”. However, we try to find at least some form of empirical basis (rather than pure subjective guesses) for the value of the adjustments we apply.
Furthermore, we cannot just present a range of analyses and remain agnostic about them (which would be standard in academia); we are making overall recommendations, thereby, we are forced to make judgement calls.
Hence, these are general features of CEAs, not specific to us.
We believe good science is not characterised by avoiding ‘choices’ (not to make a choice is to choose to favour some status quo interpretation), but ideally by making principled decisions (justified by academic precedent, and ideally pre-committed to) and showing what would happen if you made different choices7. In our analysis we attempted to pre–commit to following standard meta-analytic methods. But for the cost-effectiveness analysis, we could not tie our hands in such ways.
Let’s provide an example to illustrate all of this. In CEAs, one must consider if the data they use for the evaluation is valid. We use a meta-analysis of psychotherapy in LMICs. There is evidence suggesting that the meta-analysis is affected by publication bias. However, there are multiple methods for calculating a publication bias adjustment and no academic consensus on which one is the best. Therefore, we use a range of methods, show how adjustments vary between them, take the average of the adjustments, and apply this empirical and quantitative adjustment to the effect from the meta-analysis. In academia, presenting a range would have sufficed, but here we need to apply it for decision-making purposes.
So, our decisions are not ‘subjective’ in the sense that we made decisions unsubstantiated by evidence, based on values/intuitions, or “made up numbers” – with only one exception we were unable to find data to ground the adjustments or choices made (see footnote8).
Hence, if this research is considered subjective, we think we are in good company with anyone else undertaking similar tasks.
Disagreements with Evaluation 2
While, overall, Evaluation 2 is very positive and has some helpful suggestions, there are multiple points that we wanted to clarify.
We think that our analysis presents more information than the evaluator’s comments might suggest to the reader. The evaluator, in places, raises issues which we think we have considered and discussed, typically in our 165 page appendix. This is understandable, given the length of the document, but should be borne in mind nonetheless.
Removal of high risk of bias
About our removal of risk of bias process, Evaluator 2 mentions:
“My general standpoint is that it is more transparent to present how including and excluding high risk studies affect the estimate”
“This makes me update my assessment a little bit towards the side of this removal of high risk studies being a more subjective decision”
However, we want to make it clear that we did present how removal of different studies at different levels of risk of bias affects the results. Briefly in Sections 3.1.1 and 9.3.4 (and Table 22), and in a lot of detail in Appendix B6 and Appendix P. This is also combined with the treatment of outliers.
While the choice on whether to include or exclude high risk of bias studies is a judgement call, we believe we are justified because we have shown how the results would change otherwise and it is the most conservative of the options.
Unlike a typical academic publication we had to make a choice of which analysis to select for decision making.
Removal of outliers
Similarly, Evaluator 2 critiques our outlier analysis::
I would be very positively surprised if this cutoff for outliers was preregistered and justified in some fashion. Whether you exclude above ~1.5 SDs or 2, or 3 can be a bit arbitrary too, and so also illustrates a case where a specification curve is a sensible approach for transparent reporting. SDs of 2 are already very high in my opinion. There needs to be a clear reason for defining what constitutes an outlier. My view is that it’s always better to include the full data, analyze that, and then have a follow-up (or ideally different branch of multiverse) that drops different thresholds of outliers based on a theoretical view, previous literature, a definition of implausible data &c.
For a discussion of more principled approaches to outlier treatment in meta-analyses, see Viechtbauer, W., & Cheung, M. W. L. (2010).
We have several differences with this. Which we’ll break down in parts.
“I would be very positively surprised if this cutoff for outliers was preregistered and justified in some fashion […] it’s always better to include the full data, analyze that, and then have a follow-up (or ideally different branch of multiverse) that drops different thresholds of outliers”
We agree that the threshold for choosing how to exclude outliers can be arbitrary. Indeed there’s no one-size-fits all to identifying outliers because different data have different processes for generating outliers and different methods have different assumptions for detecting them. For example, one outlier exclusion method that is suggested in the Harrer et al. (2021) textbook lead to absurdly positive results in our analysis because it does not account for our type of meta-analysis with follow-ups over time, so we had to forgo using that one.
While our outlier exclusion was not preregistered, it was based on methodology from a previous version of this analysis. Furthermore, it was justified as explained below.
If Evaluator 2 meant that we aren’t showing the options for different exclusion criteria, we think that’s also incorrect. Just like risk of bias removals, we present an in-depth sensitivity analysis to outlier exclusion (briefly in Sections 3.1.2 and 9.3.4, and in detail in Appendix P, specifically P3).
- We present results with many different outlier exclusion criteria and potential justification for each. We chose ‘removing values above 2 SDs’ because it was similar to the other exclusion methods in terms of results, it is what Cuijpers and colleagues use in their papers, and it is easier to explain to the reader. All this is detailed in Appendix P.
- We show, in Table 22 (and with much more explanation in Appendix P), how the overall results would change if we did not exclude outliers. Excluding outliers was the conservative choice.
“My view is that it’s always better to include the full data”
We do not do this, since it inflates our effects, which we think is inappropriate. Unlike a typical analysis, in a CEA we have to choose which estimate represents our best guess. Since researchers tend to have incentives to inflate the effects in their analyses, removing outliers is the conservative option here and most likely to be our best guess.
“For a discussion of more principled approaches to outlier treatment in meta-analyses, see Viechtbauer, W., & Cheung, M. W. L. (2010).”
If the evaluator implies that we don’t use this technique, then that is incorrect. We actually do use the method by Viechtbauer & Cheung (p. 156 of the Appendix) and find that ‘removing values above 2 SDs’ is, while similar in outcome, actually more conservative.
Publication bias
Evaluator 2 mentions that “the section on adjusting for publication bias, also indicates wide researcher degrees of freedom, that would similarly be better tackled through a multiverse analysis.”
It is unclear what sort of “degrees of freedom” we are taking, but if this implies we simply picked one publication bias adjustment method instead of others, then we think that misses the level of detail that goes into our publication bias analysis in Appendix E and Appendix P.
We test many methods and go in a lot of detail, following recommendations from Carter et al. (2019). The difference with academia is that we need to then use this information directly in providing a value, rather than just presenting the options. We take an average of the adjustments suggested by each method (rather than just picking one method). Assigning equal weights to a diverse set of publication bias methods seems prudent given that the literature does not yet cohere around the general superiority of any given method.
It is unclear whether a multiverse analysis would provide a large benefit over our current methodology.
Then Evaluator 2 mentions:
“It seems particularly arbitrary to me to omit adjusting the Baird results. Whether a study is preregistered is not necessarily always a protection against potential publication bias – a preregistration wouldn’t be able to deal with some questionable research practice (QRP) such as spinning for instance, where the write-up of results and their interpretation distort them in such a way to highlight the positive findings and diminish the negative outcomes. Some have argued that preprints and working papers that show positive findings are also more likely to get shared, even if it’s not in a ‘traditional publishing’ manner.”
We really agree with the evaluator that QRPs are a problem and that preregistration is not necessarily always a protection. However, when it comes to the charity-related RCTs, this is a source of evidence for which we cannot perform typical publication bias analysis because there is only 1 RCT for StrongMinds and 4 for Friendship Bench. Therefore, we used a further rule (i.e., whether the studies follow pre-registered protocols) to determine whether we import the publication bias adjustment from the general evidence to this source of the evidence. Admittedly this is ad-hoc and lacks some clarity. But:
- Even if one concludes this is ad hoc, this is actually conservative as it decreases the overall effectiveness we estimate for the charity-related RCTs when we apply it to Friendship Bench.
- We think it is acceptable to not apply it to Baird et al. because it is only a single pre-registered study, the results are non-significant, small, and not hidden, so we do not think the motivators to distort results positively are likely to come into play here.
Adjustments
Evaluator 2 also mentions: “Generally a lot of the write-up for the adjustments has a degree of subjectivity (e.g. 10% discount for the general psychotherapy evidence vs lay therapists)”.
The application of adjustments, and how to choose them in a CEA, admittedly requires judgement calls. These do not have guidelines in the literature. This problem will apply to everyone conducting CEAs.
However, we are worried readers might think that this means our adjustments are “10%” plucked from thin air. We decided that the general evidence of the meta-analysis should be adjusted based on the characteristics of the charities evacuated. Notably, the charities deploy psychotherapy via lay therapists. We calculate the difference between lay and expert deliverers empirically, using a meta-regression of the type of delivering in the studies in our meta-analysis. Hence, the lay therapists adjustment is directly calculated based on the moderator analysis (see Section 5.2.1 and Appendix G1).
We hope that in the future, the literature or ourselves can produce more systematic guidelines and methods for producing adjustments to CEAs
This section also mentions:
Section 5.2.4 – discusses the issue of “non-compliance [in Baird et al.,] which is unrepresentative of how StrongMinds operates” and also again on p.69. I think a bit more argumentation as to why this is unrepresentative is prudent and should be provided directly in the text.
Unfortunately, we had to make choices of where to present detail about some reasoning and decisions. In the case of Baird et al., we presented more detail in Sections 3.2.2 and 7, and much more in Appendix L3. While the point that this section could have had extra write-up rather than a pointer is well taken, we want to note this in case the reader believes that no explanation is ever provided when we believe that ample argumentation is provided.
The World Happiness Report
Evaluator 2 also claims that HLI seems “more optimistic than other evaluators” based on our chapter in the World Happiness Report:
One of my major reservations is that HLI seem more optimistic than other evaluators. When looking at Figure 8.2 in their chapter in the World Happiness Report[5] there is a very notable evaluator effect. I ran a quick regression based on the values reported in the figure using evaluator and depth of analysis as predictors; evaluator effects were coded as a mean contrast, i.e. calculating deviations from the grand mean of all evaluators. This revealed a 25.2 point increase in the estimated value, i.e. WELLBYs generated per $1000, if the evaluator is HLI (p = 0.01 even with this small sample size of 19 observations). See also Figure 8.4, where the average cost-effectiveness for HLI is $42 per WELLBY, whereas the second best one is State of Life, at $248 per WELLBY. How likely is that HLI are finding and evaluating the most cost-effective programs vs having a positive bias?
To their credit, HLI do discuss this on p. 242 of the same chapter. Nevertheless, taking this all into account, this stills errs me on the side of being more cautious about the current report too, and recommending if they have capacity to select charities and commission external CEAs.
However, we do not think this is the case. As we explain in our WHR chapter, we collated estimates from 4 WELLBY evaluators (ourselves + 3 others), and these conduct their CEAs differently. HLI is the only evaluator who actively looked for the most cost-effective organisation and focused on LMICs.
The other WELLBY evaluators engage in something akin to convenience evaluating, primarily of charities in the HICs like the UK. As expected, the most cost-effective charity from the other WELLBY evaluators is the only one they evaluate in a LIC, Tearfund.
Furthermore, the other WELLBY evaluators do not apply adjustments for external and internal validity like we do (for even more detail, see p. 3 of the appendix for the WHR chapter). These adjustments are almost always ‘pessimistic’ in the sense they reduce the estimated effects of charities or interventions.
The regression analysis doesn’t seem very appropriate to test this hypothesis. To test optimism versus pessimism we would either need to think that evaluators randomly draw different charities from the same distribution or we would need to have multiple evaluations of the same charity. We do not have the latter and the former is not a reasonable claim given the stated differences in selection processes across evaluators.
Also note that if we add whether the charity is in a HIC or LMIC as a covariate in the regression, the significance disappears and the difference reduces.
Notable agreements
We agree with the evaluators that our write-up could be clearer and benefit from extra visualisations. Notably visualisation of how the different choices affect the results. We had considered these things, but it was becoming difficult to fit everything in without this report becoming even longer. We were hitting diminishing marginal returns in terms of time invested. We are hoping that our future reports will be even clearer.
We also agree with Evaluator 1 that, indeed, it would be better if we had a clearer set of what our adjustments, choices, and processes should be. As aforementioned, charity cost-effectiveness evaluation is still relatively novel, thereby, no gold standard process and list of adjustment has been created. We are still crystallising our methods as our work continues.
We agree with Evaluator 2 that gender would have been an interesting moderator to include in our model. However, we did not include the necessary data for this, and we don’t believe it will influence the final outcome by much. But we hope further work can investigate this topic.
3. Minor replies to evaluators
We briefly answer many comments made by the evaluators. This is for matters of public record, the important points have all been mentioned above.
This response would become very long if we did full quotes of every comment. Instead, we refer the reader to the comment we are answering and provide some context. This is adapted from our private response to the evaluators.
Evaluation 1
(‘Written report’ section.)
Evaluator 1 mentions:
I would be substantially more confident in the comparative cost-effectiveness estimates if the authors provided a clear set of rules for the adjustments they are making, along with a list of these adjustments to be applied consistently across all evaluated projects. Given the number of choices the authors need to make, it is unlikely that every reader will be convinced by all of them — though they are well justified.
Evaluator 1 also mentions:
My main concern is that there are many project-specific choices that the authors make for each evaluation. Some of them affect the coefficients significantly. Because it is a lengthy and detailed report, it is not clear how much each of these choices affects the final result. These are all perfectly justifiable modelling choices. However, given the complexity of the task and the level of uncertainty involved, one might imagine a different set of perfectly justifiable choices (more on this below), that might lead to a different ranking. To be clear, the authors are largely choosing more conservative estimates across available options.
We thank the evaluator for the detailed and thoughtful ponderings on the adjustments. Indeed, it would be better if we had a clearer set of adjustments and processes. Charity cost-effectiveness evaluation is still relatively novel, thereby, no gold standard process and list of adjustment has been created. We are still crystallising our methods as our work continues.
We try to communicate a maximum of how different options affect results. In Section 9 especially, and Appendices G, O, and P. We also discuss the weights in detail in Section 7 (and Appendix L). Some variables we discuss their impact in their sections as well (for example Section 5.1.4).
We could do more of this but we have hit diminishing marginal returns with our time. Thank you for acknowledging that these are justifiable choices and that we use conservative estimates. We are unsure if there are many alternative modelling choices that are justifiable that we did not present in some way, other than ‘considerations about decay over time’ and ‘gender as a moderator’ put forward by the evaluators.
In the future, we can make for clearer presentations of all the adjustments, especially for analyses that have smaller scopes than this one. It was difficult trying to fit everything in without this report becoming even longer.
(‘My comments’ Point 1. Clarify evidence hierarchy.) Yes, we did not clarify in the report which type of evidence we would consider ideal. While we ideally want evidence with high internal and external validity, in practice there is often a tradeoff between the two and it’s unclear how exactly one should weight each. Ideally, we have convergent evidence that covers both of these.
(‘My comments’ Point 2. Systematize adjustments.) These comments make a general point about having set out rules for adjustments. As we replied in the subsection above, this would be ideal but is not currently easy to provide for CEAs.
One area where we are less consistent – according to Evaluator 1 – is that we use different sources to generate external validity adjustments. Notably, we use a moderator model in the general meta-analysis for adjustments about charity characteristics like whether the psychotherapy is delivered by lay or expert deliverers. But, we use a different adjustment for dosage.
We decided on predictors in the moderator model based on theory – rather than statistical significance – of what are the relevant factors for external validity. However, two further factors came into play, which we acknowledge are atypical.
First, the predictor for dosage was so small and non-significant as to suggest almost no effect of dosage. We are concerned about the small dosage of Friendship Bench, and we still find it very surprising that dosage has no detectable effect; therefore, we thought it more conservative to use a more severe adjustment for dosage (see Appendix G2.3.2 for more detail).
Second, other variables that could have been used for charity characteristics did not have much impact and weren’t as clearly important as the core two (group and expertise). Considering our report is already long and complex, we decided to simplify our model (which was also conservative; see Appendix G1).
We provide more detail about the choice of modelling and the effects of moderators in Appendix G, especially G1, G2, and G4.
(‘My comments’ Point 3. Sensitivity analysis/multiverse.) Evaluator 1 suggests that a visual summary of how different adjustments or modelling choices affect results would be useful, and we agree. We pondered it but did not proceed because of time constraints.
In this point they also make two further comments about alternative choices that could significantly affect results.
> “The authors include Baird et al. as an RCT related to the programme, yet they explain in detail that the implementation, target group, and other key characteristics differ. Given all the differences, it is not clear why this paper should not be included in the meta-analysis instead.”
This is a good point. As we’ve discussed this work with others and obtained reviews, we have found that people hold a very wide range of views on how to treat and weight different sources of evidence. We believe that, while Baird et al.’s relevance to how StrongMinds operates today is questionable, it would still count as distinct from other studies in the meta-analysis. Nevertheless, we endeavoured to present how alternative approaches would work. In Appendix L3.4 and Section 7.3 p. 69, we briefly show that Baird et al. would have ~3% of the weight if directly included in the meta-analysis, rather than ~20% as per our current methodology. For readers who think Baird et al. should just be included with the general meta-analysis, they can take the results putting 100% of the weight on the general meta-analysis as a guide (increasing the cost-effectiveness to 51 WBp1k; see Table 22 on page 80).
> “The authors inflate the cost estimate for StrongMinds from $31 (based on the 2024 report) to $44.60. Without this adjustment – or if it were only partially applied – StrongMinds would appear more cost-effective than Friendship Bench.“
We inflate the 2023 cost of $41 to $45 based on concerns about counterfactual attribution to StrongMinds of clients treated via partners. The cost-effectiveness increases to 44 WBp1k if we do not apply this adjustment (see Table 21 on page 80; note that there was a mistake in that table, the numbers for two cost adjustments were inverted, this has allowed us to correct this now). We only use 2023 costs because that was the last complete year at the time of writing the report. We continue to monitor the charities we evaluate, and we are aware that costs have dramatically decreased for StrongMinds in 2024, which we will write an update about.
(‘My comments’ Point 4. Meta-analysis issues) Evaluator 1 asks three questions about the meta-analysis which we answer here.
[A. Weighting outcomes] We use multilevel modelling to adjust for dependency between the data points and to avoid less appropriate methodology such as picking only one outcome per study. This is explained in Section 2.2 and Appendix C3.
[B. Mental health vs. wellbeing — clarify distinction] Because this is a common element to many of our analyses, an explanation of the relationship between affective mental health and wellbeing is in a separate report. Indeed, the colour-coding in Figure B3 could be improved, although information about which study is MHa and which is SWB will be presented in the separate report. The colours represent different study-outcomes combinations. We do present a comparison of the effect of outcomes in Appendix G3.5.
[C. Which therapies?] As per our protocol, as long as it is psychotherapy, we include it. We exclude studies if the patients primarily have externalising disorders or if the comparison group is a different type of mental health support that the treatment group is not also receiving. We do test whether different modalities of psychotherapy affect results in Appendix G3.6, but find non-significant results.
(‘Other comments’ Point 1) Evaluator 1 points out that household spillovers will make interventions that happen in places with larger households more cost-effective. While they don’t think this is a problem, they do wonder whether there might be interactions between household size and spillover sizes that could mitigate this.
We also don’t consider it a bug that some interventions happen in places where there are more household members and thereby will be more cost-effective. We agree that there might be more dynamics at play. However, there is too little research about spillovers, much more should be conducted in order to answer these questions in more depth. In our spillover analysis we try to find data from LMICs, which would have larger households than in HICs.
(‘Other comments’ Point 2) Similar to the point above, we also consider it a feature, not a bug, that programmes will be more cost-effective if delivered in a country where costs are lower because purchasing power is lower (everything else held constant).
(‘Other comments’ Point 3 – see also discussion at the end of the evaluation) Evaluator 1 presents insights about the modelling of effects overtime of psychotherapy. We thank them for their insights and their discussion with Evaluator 2.
Notably, they point out that linear decay to zero – the method we selected – would be a conservative assumption, which is reassuring. We have done some quick tests using exponential decay and found little difference between the two models. We might produce a follow-up about this specific point in the future.
(‘Other comments’ Point 4) Evaluator 1 asks for a histogram of how the effect of the meta-analysis would shift according to different exclusion criteria regarding risk of bias (low, some concerns, high). We already present the models with and without different levels of risk of bias in Appendix P4 (as well as a figure for only low risk of bias effects). Perhaps extra histograms could be useful to see the distribution but we ran out of time.
(‘Other comments’ Point 5) On p.27, we state “See Appendix P for how much it influences the analysis (not much).” and Evaluator 1 mentions “It would be helpful to quantify this more precisely — for example, by indicating the percentage change.” Yes, we could provide more information in that statement. It would have to be a range, as different versions of the analysis lead to different effects. We do provide the details in Appendix P (and some in Section 9), though, so we decided we did not need to repeat the information.
(‘Other comments’ Point 6) Evaluator 1 asks how we obtain our final confidence intervals. We use Monte Carlo simulations to propagate uncertainty across calculations and obtain percentile 95% confidence intervals. Readers can see it in Section 2.2.49.
(‘Other comments’ Point 7) Evaluator asks for clarification about a sentence which had a typo in our report. Instead, it should read: “Moreover, spillovers can be greater or lesser for one intervention: our previous working has found that cash transfers have a relatively bigger spillover effect than cash psychotherapy.” Namely, the spillover ratio for cash transfers is larger than currently estimated for psychotherapy, so we cannot just assume all interventions have the same spillovers. This is now corrected in the report.
(‘Other comments’ Point 8) Evaluator 1 asks: “Regarding variance adjustments: I understand that initial response variance is lower among respondents above the clinical threshold compared to the general population. However, we would also expect the treatment effect to be larger in that group. How does this affect your analysis?”
As we detail in Appendix F, range restriction is a phenomenon that would artificially inflate outcomes based on selection of people who are above the clinical threshold; hence, a variance adjustment. However, the evaluator rightly notes that an intervention on people above the clinical threshold could have higher effects. This would be a feature, not a bug. It seems intuitive that treating those who are worse off leads to bigger effects. We discuss this in Appendix G3.3 and G3.4. We find non-significant evidence in support that effects are larger on clinical populations than on general populations. And some small significant evidence in favour that treating those worse off (i.e., lower down the wellbeing scales) leads to bigger outcomes. Both analyses have limitations in sample and scope so we wouldn’t draw large conclusions from this alone.
Evaluation 2
(‘Major recommendations’ Points 1-3) Evaluator 2 makes multiple recommendations about communications and the write-up of the report.
We are grateful for these. Indeed, we agree that a visually appealing and easy summary would be useful (and the notes in Footnote 8 by Evaluator 1 are helpful). And we acknowledge the document is long and not easy to read. It has been difficult to determine how to communicate everything that goes into this analysis, and we are still learning how to best present our work and hope to make the presentation of future CEAs more streamlined.
Evaluator 2 also mentions ‘intangibles’ of how interventions might affect many pathways (jobs, health, etc.) and how these would benefit from being captured and expressed in our report. We do think that with wellbeing as the ultimate common outcome that is affected by all other factors that affect someone’s life, and our modelling of longterm effects, we are covering a lot of these concerns and capturing them in the effect. Nonetheless, it is true that we could communicate this better, and we have been attempting to do so in other reports where we, for example, discuss causal mechanisms (e.g., Stewart et al., 2024).
(‘Major recommendations’ Point 4) Evaluator 2 suggests conducting a multiverse analysis. We thank them for this recommendation.
We had discussed the possibility of doing a multiverse analysis but decided against it because of limited time. Also, some of our analytical choices are dependent on each other, and some of them are continuous variables, which makes the whole process more complex than simply combining choices.
There are many possible combinations of analytical choices (meta-analysis models, outliers, risk of bias, publication bias, different adjustments with multiple choices within, spillovers, other CEA choices, etc.), which takes time to implement. We did include a detailed list of alternative choices and results in our sensitivity analysis, our appendix, and our report more generally:
- In Appendix C (especially Table C2), we consider 6 different meta-analysis models.
- In Appendix E we present 8 publication bias methods.
- In Appendix G we consider many different moderator models, including 13 versions of the dosage adjustment.
- In Section 7.4 we present the continuous alternative effect of different weighting choices.
- In Section 9 and Appendix O, we consider 12-14 alternative analyses (including combination of alternative analyses).
- In Appendix P we consider 3 alternative analyses with or without outlier exclusion and removal of high risk of bias analyses. We present 10 different outlier exclusion methods (times the 8 publication bias methods). We consider two analyses with only low risk of bias studies.
- Everything times 2 because we are evaluating two charities.
This is a much larger scope of choices than, for example, the multiverse meta-analysis by Plessen et al. (2023) that the evaluator cites. From the papers cited by the evaluator, we conclude that the main element we are lacking is a large summary graph (i.e., a specification curve). To do so would be computationally taxing as we’d have to code a combination of each of these choices above and propagate the results until the end point.
From the rest of the comment, we conclude that there is an extra quantitative advantage from a multiverse analysis because we could get (1) more detail about which variables are the most influential (we already have that to some extent with our sensitivity analysis) and (2) more descriptions of statistical uncertainty (we do describe statistical uncertainty around our estimates as per our confidence intervals, but this would be an extra level).
Nevertheless, it seems like there are still some constraints. Namely, we would have to make choices about which analyses to include or not (or how to weight them) because not all choices are equal.
Evaluator 2 does not seem to mention the really large presentation of alternative analytical choices we have made (see our ‘Major replies’ section). We are unsure whether they are taking this into account when suggesting we should conduct a multiverse analysis.
While we could have provided more information about statistical uncertainty, and a multiverse would be an exciting development to the analysis, it is unclear how beneficial this would be considering the cost. We are happy to be convinced otherwise.
(‘Major recommendations’ Points 5-6) Evaluator 2 suggests we commission reviews, red-teaming, or even competitions for evaluations of our reports and pre-registrations. As can be seen by the extensive list of reviewers in our report, this work has been shown to many different people. We hope to continue to have reviews of our future report (and pre-registrations). More formal red-teaming work would be of interest, but we lack the time and monetary resources to do so.
(“Further comments” – Access to data and pre-registration) At the time of the evaluation, the evaluator could not find the detail of our preregistration because the PROSPERO link was broken. We have fixed it now. In the OSF we have the latest protocol information and the PROSPERO id which can be used to find the PROSPERO again.
(“Further comments – Use and Assumptions of WELLBYs, conversions”) The evaluator asks a series of clarifying questions about what we count as ‘affective mental health’ measures.
We agree, our definition of ‘affective mental health’ is lacking a detailed list of measures. We had considered it but decided it was not useful to compile a full list in the time we had. The general sense is that they aren’t typical wellbeing measures (e.g., life satisfaction) but standardly useful mental health surveys that measure mental distress or low mood. An explanation of the relationship between affective mental health and wellbeing is in a separate report. It is still under construction because we focused on the World Happiness report recently. More detail will also be available when we publish the meta-analysis in academia.
The comment made by Evaluator 2 – if we understand correctly – seems to confound the population targeted (which is ‘common mental health disorders’ like depression, anxiety, and trauma) and the outcomes used (affective mental health outcomes, as described above, or, in “Primary outcomes” in our pre-reg). Let us clarify with an example in our research where the two are more clearly distinct: in our cash meta-analysis, we look at affective mental health outcomes, no matter the psychological profile of the recipients because these are cash transfers for people in poverty.
We very much agree that the labels in Table G19 are informal, and that is part of why it doesn’t form a core moderator model. We would count “general MH” as ‘affective mental health’. This includes measures like the GHQ.
(“Further comments – Validity Adjustments (External Relevance & Dosage)”) Evaluator 2 provides insight about Friendship Bench for which we are grateful. We agree that psychoeducation is probably one of the major factors explaining why Friendship Bench’s treatment can still be effective despite the low dosage. Friendship Bench are currently looking into improvements to their M&E to help answer some of these questions. The evaluator also mentions mass communication programmes, which are interesting and we might look into them in the future.
(“Further comments – Modelling decay over time”) Evaluator 2 asks why we chose a linear decay model and how we justify that choice. The linear model was the simplest to implement in a meta-regression and provided a clear stopping point for the integral (this is a harder decision with an exponential model). We have done some quick tests using exponential decay and found little difference between the two models. We might produce a follow-up about this specific point in the future.
(“Other considerations – Weights”) Evaluator 2 provides comments on the weights we use in Section 7, and agrees we are transparent about how speculative these can be.
Ideally, Evaluator 2 would want a table of the 84 studies we had in our meta-analysis with characteristics that would help them understand the weights more. We will provide a detailed descriptive “Table 1” of the characteristics of the studies when we publish the systematic review and meta-analysis in academia.
They also suggested publishing the weights of the different team members (we only published the average). We decided against publishing them because we would have had to provide write-ups for each team member’s weighting. This would have taken too much time and space so we decided on only providing a general explanation of the average weights. Perhaps we could have presented them without explanation.
(“Other considerations – Dosage”) Evaluator 2 asks for further justification about why we still applied a conservative dosage adjustment despite the effect of dosage being small and non-significant in the meta-analysis.
We do provide some explanation in Section 5.2.2 up to “Instead of relying on an uncertain coefficient from our moderator analysis we do a simple calculation of dosage, where we assume a logarithmic dose-response relationship.” But we agree that it is missing a clearer explanation that we are not accepting the null results and still considering, for conservative reasons, that we should adjust the effects of the charities down for differences in dosage, especially for the very low dosage of Friendship Bench. We provide some detail about all the different possible dosage adjustments in Appendix G, especially G2.3.2. We are reassured to hear that the evaluator also finds the results of the dosage moderator surprising.
(“Minor point – Gender”)
The evaluator suggested that considering the effect through the lens of gender might be worthwhile. Yes, we think this would have been an interesting moderator to extract and consider. We did not extract the % of women in each study, unfortunately. We don’t think this would strongly affect the results.
For the version of this response on the Unjournal website see here.