

Summary
Lead is a heavy metal that is toxic to humans, especially children (WHO, 2021). There are about 815 million children in the world with levels of exposure that are considered harmful (Pure Earth & UNICEF, 2020). This represents a potentially enormous loss of wellbeing in the world. Lead exposure can come from a range of – sometimes surprising – sources such as paint, spices, cosmetics, battery recycling sites, ceramic and aluminium cookware, etc., and it can permanently impair physical, mental, and emotional health.
In this report we conduct our own shallow evaluation of a new lead project targeting leaded cosmetics applied to children in Ghana being carried out by Pure Earth. Pure Earth is a non-profit environmental health organisation which focuses on protecting people and the environment from the harms of toxic pollution. Their current focus is on reducing lead and mercury poisoning in low- and middle-income countries.
This forms part of our broader work to assess the cost-effectiveness of interventions and charities based on their impact on subjective wellbeing, measured in terms of wellbeing-adjusted life years (WELLBYs). One WELLBY is equivalent to a 1-point increase on a 0-10 wellbeing scale for one person over one year. We focus on subjective wellbeing because it is what ultimately matters in determining if someone’s life is going well. By using wellbeing as a common outcome, it allows to make apples-to-apples comparisons between very different interventions.
We estimate that funding Pure Earth’s project to target cosmetics in Ghana will be highly cost-effective and produce 105 WELLBY per $1,000 donated to the organisation (‘WBp1k’), or, conversely, it would cost $9.49 to produce one WELLBY via this project.
For context, this is 14 times more cost-effective than GiveDirectly for which we estimated the cost-effectiveness at 7.55 WBp1k (i.e., $132 per WELLBY; McGuire et al., 2022a). GiveDirectly is an NGO which provides cash transfers to very poor households. We take cash transfers as a useful benchmark because they are a straightforward, plausibly cost-effective intervention with a solid evidence base. (For more detailed and updated charity comparisons, see our charity evaluations page.)
In the rest of this summary we describe the cosmetics project in more detail, discuss the funding landscape in the anti-lead-exposure space, and the strength and limitations of our analysis.
The cosmetics project
In a survey of 3,227 children in Ghana, Pure Earth found that 93% from the Northern part of Ghana used Chilo (often known as ‘Kohl’), a type of eyeliner applied to both girls and boys, even at a very young age. This sort of eyeliner has regularly been found to have elevated levels of lead. The lead would be orally ingested through hand to mouth contact or absorbed through the skin and cause adverse effects on the children’s development and wellbeing. Chilo is not the only cosmetic which might contain lead in Ghana, but Pure Earth believes it is the primary source, and our modelling throughout reflects this.
Pure Earth’s programme will be in two parts. The first part will involve advocacy to the government and data collection to help them target and neutralise the source of the lead in cosmetics with regulations and enforcement. They expect this to take ~2 years. The second part will involve technical assistance to ensure new regulations are followed and enforced. This part will be carried out over ~3 years. To our knowledge this is the first evaluation of a program targeting lead in cosmetics.
Funding to reduce lead exposure
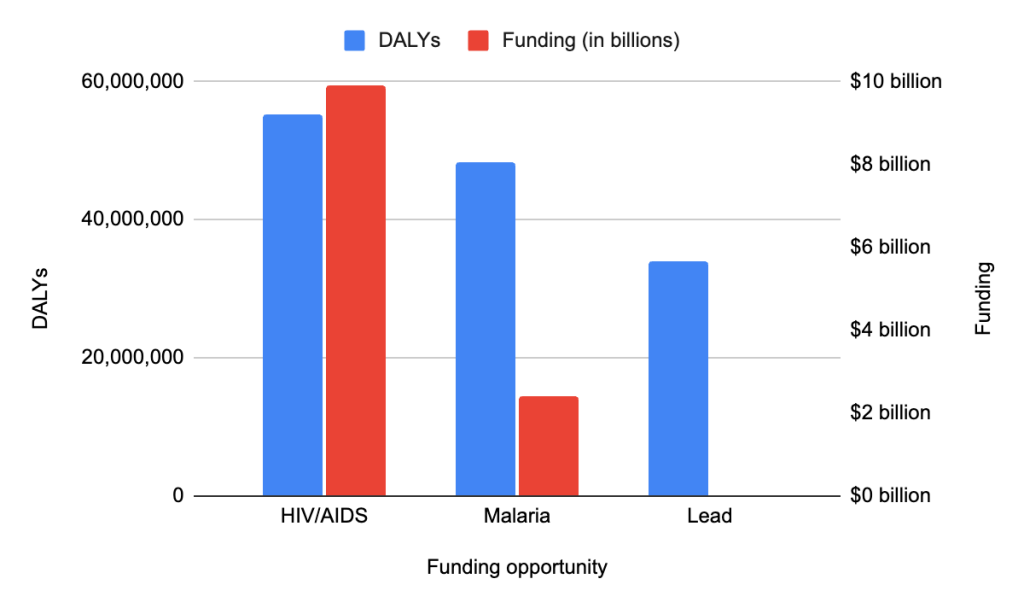
Lead exposure is associated with a similar health burden as HIV/AIDS and malaria (measured in DALYs; IHME, 2021). Despite that, in 2021, lead exposure programmes received only around $10 million in funding compared to the $2.4 billion malaria received (240x lead funding), and the $9.9 billion HIV/AIDS (990x lead funding) received (Pure Earth Annual Report 2022/23). Malaria and HIV/AIDS are themselves often considered neglected; hence, lead exposure would qualify as potentially very neglected.
Reducing lead exposure also appears tractable (i.e., feasible to address effectively). It seems policies to reduce lead in products, reduces the lead in people. For example, in the US blood lead levels (BLLs) dropped by 94% between the late 1970s and 2017 due to regulation on petrol and paints (Dignam et al, 2019). On top of that, it also seems like conducting advocacy and providing technical assistance is effective at getting governments to take action. For instance, between 2019 to 2021, Stanford University’s advocacy and technical assistance in Bangladesh resulted in the lead chromate added to turmeric decreasing from 30% to 0% (Forsyth et al., 2023). Intuitively, we think this is because lead is not a politicised issue, and its neglectedness by governments is more due to a simple lack of knowledge than anything else. Thus, when governments are made aware of the issue, and offered the technical assistance to solve it, they gladly and quickly accept.
Hence, attention and funding for combatting lead exposure is growing. The grantmaking organisation Open Philanthropy recently launched the Lead Exposure Action Fund (LEAF) to support charities working on reducing lead exposure. This is their biggest collaboration to date, with over $104 million already committed. While this is good news, does this new fund mean the good funding opportunities have already been filled?
At the time of writing, we know that the Lead Exposure Elimination Project (LEEP) and Pure Earth’s spice programmes are currently funded. Nevertheless, Pure Earth has more projects they can tackle with extra funding, this cosmetic project being one of them which they think will be successful and impactful. Pure Earth still needs to secure funding of $1.8 million over 5 years for the Ghana cosmetics project which involves advocacy and follow-up work to ensure enforcement. The timeliness of this project is key to make use of the current momentum in Ghana for lead regulations.
Strengths and limitations of our analysis
Ideally, we would base our analysis on causal studies that show the long-term impact on wellbeing from Pure Earth intervening in an area. This evidence does not exist, so instead we estimate this effect by combining three sources of less certain evidence:
- information about lead levels due to cosmetics in Ghana
- a prediction of how much Pure Earth will reduce this exposure (based on advocacy, which is generally more uncertain to model)
- a general link between blood lead levels and wellbeing
Overall, we assess the quality of evidence is ‘low’. The depth of our evaluation is relatively shallow, meaning we have completed only some (10-60%) of the analyses we think are needed. Therefore, our evaluation is speculative.
Throughout our analysis we decide to use conservative assumptions in order to account for this uncertainty. If we relaxed some of these assumptions, we find that the cost-effectiveness could reasonably rise from 105 → 927 WBp1k. This is despite some steep discounts for poor evidence quality, still not being relaxed.
We model the benefits of reducing lead exposure as removing the exposure in childhood which results in a reduction in wellbeing harm over the whole lifespan. We know lead exposure in adulthood can still do harm to the adult, but childhood exposure to adult outcomes is the most prevalent and best researched pathway.
Despite this being the best researched pathway, one core concern is causal identification of the link between lead exposure in childhood and later harms, especially the impact on wellbeing. In total we found only three papers in our brief search which employ a causal identification strategy to identify the impact of lead on long-term outcomes. However, none of these long-term outcomes analysed in these papers are subjective wellbeing or mental health outcomes. Instead, to understand the impact on wellbeing, we must rely on the meta-analytic effect from three correlational studies (n = 1,157). Thus, we suggest that while the cost-effectiveness of lead looks very promising, we would place great value on research using causal identification strategies to study the impact of childhood lead exposure on adult subjective wellbeing or mental health.
We are concerned about the similarities we see in the philanthropic world’s approach to lead exposure and to deworming. When deworming was first put forward as a cost-effective funding opportunity, people got very excited. But these analyses were based on uncertain estimates of long-term benefits, held up by the very low price per person. More recent evaluations of deworming have been more tempered. While we think the evidence for the badness of lead exposure is stronger, lead is in a similar place in that there are few causal estimates and the cost-per-person affected is very low which drives the high cost-effectiveness (as opposed to a high per-person effect which is easier to observe and measure).
We think there are lots of reasons to believe that more research would definitively prove lead is a very harmful substance for long-term wellbeing. Most importantly, we have seen some preliminary causal results which suggest a far greater effect than our meta-analysis, and use a considerably larger number of observations. Unfortunately these results are still preliminary so we are unable to share them. Additionally, there has been some causal data relating childhood lead to adult outcomes (such as income, crime and cognitive functioning) which are related to wellbeing, and implies we would expect wellbeing to also be harmed by childhood lead exposure.
We suggest some ways which we think academics could help strengthen the evidence base on the link between lead and wellbeing in Appendix E. Funding and gathering more causal evidence should be of the highest priority. With stronger causal evidence, we would be much more confident in recommending charities and interventions tackling lead exposure.
Conclusions
In conclusion, we find that this intervention has the highest cost-effectiveness of any opportunity we have reviewed so far. This somewhat offsets our concerns about evidence quality, because we have used conservative figures throughout and so this high cost-effectiveness is still a lower bound figure. Nonetheless, we suggest treating lead with a healthy amount of caution until we have stronger evidence lest the mistakes made in the past with deworming are repeated. It is also worth noting that this intervention has the possibility of succeeding, failing, or something in between. Our estimate captures the expected impact of the intervention, taking the likelihood of success into account. This means that, if the intervention is successful, the impact of the intervention will be greater than our estimate. But on the other hand, if the intervention fails, the impact could be small. Thus, this giving opportunity is particularly well-suited for donors who are comfortable with some uncertainty about the impact of their donation.
Notes and acknowledgements
Version note:
- In 2022 we performed a shallow exploration of reducing lead exposure as a cause area (McGuire et al., 2023b). We rely heavily on this for this report.
- In July 2025 we corrected an error in how we calculated the increase in the cost of the programme based on Pure Earth’s overhead. This increased the programme cost from $2,093,235 to $2,150,302, slightly reducing the cost-effectiveness from 108 to 105 WBp1k. The previous version of this report can be found here (and the calculations here). Our World Happiness Report chapter was before this edit, but our living review will take it into account.
Summary spreadsheet note: There is a summary spreadsheet available. But note that some of our analysis is conducted in R and explained in the report.
Author note: Ben Stewart, Samuel Dupret, Joel McGuire, and Ryan Dwyer contributed to the conceptualization, investigation, analysis, data curation, and writing of the project. Michael Plant contributed to the conceptualization, supervision, and writing.
The views expressed in this document do not necessarily reflect the perspectives of employees of the evaluated charities.
Charity information note: We thank Kate Porterfield, Drew McCartor, and Carol Sumkin for providing information about Pure Earth.
0. Outline
In Section 1 we set out the context for the report and point to some of our previous work.
In Section 2 we give context to the issue of lead exposure. How is it measured and how big is the problem?
In Section 3 we introduce and give some background information on Pure Earth.
In Section 4 we introduce the intervention we are analysing - Pure Earth’s campaign to remove lead from cosmetics in Ghana. We explain why we have chosen to focus on this particular intervention, and how Pure Earth plans to address this issue.
In Section 5 we explore the current literature on the relationship between blood lead levels (BLLs) and later in life mental health and wellbeing. We also lay out the model we use for this evidence and explain our assumptions.
In Section 6 we estimate the WELLBYs we expect this intervention to produce. In the first three subsections we estimate how much we think this campaign is likely to lower the BLLs of children in Ghana. Next we consider when we think the Ghanaian government is likely to implement and enforce this reduction anyway without Pure Earth (the counterfactual). With this information we are able to calculate our estimated total individual wellbeing effect of this policy. To this we then apply some discounts to account for our concerns regarding causality, replication, and generalisability. Next we add spillover effects. Finally we summarise the findings of the section and state the overall expected WELLBYs produced by this intervention.
In Section 7 we calculate the cost effectiveness of this intervention.
In Section 8 we discuss the funding gap for this intervention.
In Section 9 we discuss our confidence in our results. We summarise some of the conservative assumptions we make in this analysis and then see what happens if we relax some of them. We then highlight some of the guesses and weaknesses of this analysis and make a call for more research into how much harm lead does.
Finally, in Section 10 we conclude the paper, summarising our views and findings.
1. Context for this report
In 2022 we performed a shallow exploration of reducing lead exposure as a cause area (McGuire et al., 2023b). We concluded that something in this area would probably hold cost-effective opportunities for improving wellbeing. Note that we heavily rely on this previous research and sometimes directly copy some of it into this report.
Clearest amongst these opportunities was the Lead Exposure Elimination Project (LEEP) and their successful advocacy campaign to remove lead from paint. We contacted them earlier this year to begin an evaluation of their programme, but they reported having sufficient funding. This led us to turn to Pure Earth, another organisation working on reducing lead exposure. Some of their projects, such as projects tackling leaded spice in India, are also funded, but not all.
Pure Earth specifically invited us to evaluate the cost-effectiveness of their ongoing effort to support the government in Ghana to remove lead from cosmetics. We agreed that this was a promising opportunity, and so sought to evaluate it here. We might, in the future, evaluate a wider range of Pure Earth’s programmes.
2. The problem: lead exposure is bad
This section relies heavily on our previous lead report (McGuire et al., 2023b).
2.1 How is lead exposure measured?
The most common measure of lead exposure, and the one we use in this report, is blood lead levels (BLLs). This measure indicates the amount of lead in micrograms (1 millionth of a gram) per deciliter of blood (μg/dL or mcg/dL). BLLs mainly represent current levels of exposure and lead burden in the body because BLLs decrease quickly after exposure ceases. Bone lead levels represent long-term levels of lead. We discuss these measures in more detail in a footnoteAfter exposure ends, BLLs will half every 35 days. Lead clears from the bloodstream by exiting the body (e.g., through waste) or depositing into bone. However, BLLs do not only reflect current exposure because lead in the blood is slowly replenished by lead deposits in the bone; hence, when one is removed from lead exposure after a long time of exposure, their BLLs will decline rapidly before stabilising as lead from bone storage enters the bloodstream. Bone lead levels (in the tibia or patella) have a half-life of multiple decades (Obeng-Gyasi, 2008, mentions “up to 30 years”, p. 3); hence, they provide a good measure of the long-term cumulative burden of lead in the body and is a potential pathway for long-term effects of lead by restoring lead to the bloodstream over time. Another cumulative measure is a cumulative blood lead index, calculated by combining BLLs over time. BLLs tell us about current exposure whereas bone lead levels can help us measure the long-term consequences of lead exposure (Shih et al., 2007). It appears that BLLs are used much more frequently to test for lead exposure because they can be measured with a relatively cheap blood test while assessing lead levels in bones requires an x-ray. See Hu et al. (2007), for a review of how lead levels are measured in the body..
2.2 What is the case for looking at lead exposure?
Globally, BLLs have been declining over the last 50 years or so, primarily due to the phasing out of leaded gasoline (Lacerda et al., 2023). For example, US children today (born after 2006) have on average BLLs less than 1 μg/dL (Tsoi et al., 2016). This implies a 95% reduction from children’s levels in 1978 (OWID, CDC; 2024).
Meanwhile in low and middle-income countries (LMICs) where most of the world’s population lives, Ericson et al. (2021) estimate that of the 632 million children in LMICs 48.5% have blood lead levels higher than the CDC’s formerThe CDC states “This level is based on the 97.5th percentile of the blood lead values among U.S. children ages 1-5 years from 2015-2016 and 2017-2018 National Health and Nutrition Examination Survey (NHANES) cycles.” (CDC, 2021). They have since lowered that level to 3.5 μg/dL based on new data that BLLs continue to decrease in the USA. reference level of 5 μg/dL. According to Pure Earth and UNICEF (2020), there are about 815 million children in the world with BLLs above 5 μg/dL and 176 million with lead levels above 10 μg/dL. This indicates that there is still much work to be done to decrease lead exposure, of which any amount is considered harmful (CDC, 2024).
In fact lead exposure is associated with a similar health burden as HIV/AIDS and malaria (measured in DALYs; IHME, 2021). Despite that, in 2021, lead exposure programmes received only around $10 million in funding compared to the $2.4 billion malaria received (240x lead funding), and the $9.9 billion HIV/AIDS (990x lead funding) received (Pure Earth Annual Report 2022/23). See Figure 1 for an illustration. To put this into perspective, if we stretched the scale of the Figure 1 below so that the bar representing funding for HIV/AIDs was the height of an average two-storey house, the bar representing funding for lead would still be less than a centimetre tall. Malaria and HIV/AIDS are themselves often considered neglected; hence, lead exposure would qualify as potentially very neglected.
Figure 1: DALYs vs Funding in 2021 of different diseases.
Reducing lead exposure also appears tractable (i.e., feasible to address effectively). It seems policies to reduce lead in products, reduces the lead in people. For example, in the US blood lead levels (BLLs) dropped by 94% between the late 1970s and 2017 due to regulation on petrol and paints (Dignam et al, 2019). On top of that, it also seems like conducting advocacy and providing technical assistance is effective at getting governments to take action. For instance, between 2019 to 2021, Stanford University’s advocacy and technical assistance in Bangladesh resulted in the lead chromate added to turmeric decreasing from 30% to 0% (Forsyth et al., 2023). Intuitively, we think this is because lead is not a politicised issue, and its neglectedness by governments is more due to a simple lack of knowledge than anything else. Thus, when governments are made aware of the issue, and offered the technical assistance to solve it, they gladly and quickly accept.
2.3 What are the mechanisms for the effect of lead exposure on wellbeing?
This section is taken entirely from Sections 2, 2.1, and 2.2 in our previous lead report (McGuire et al., 2023b).
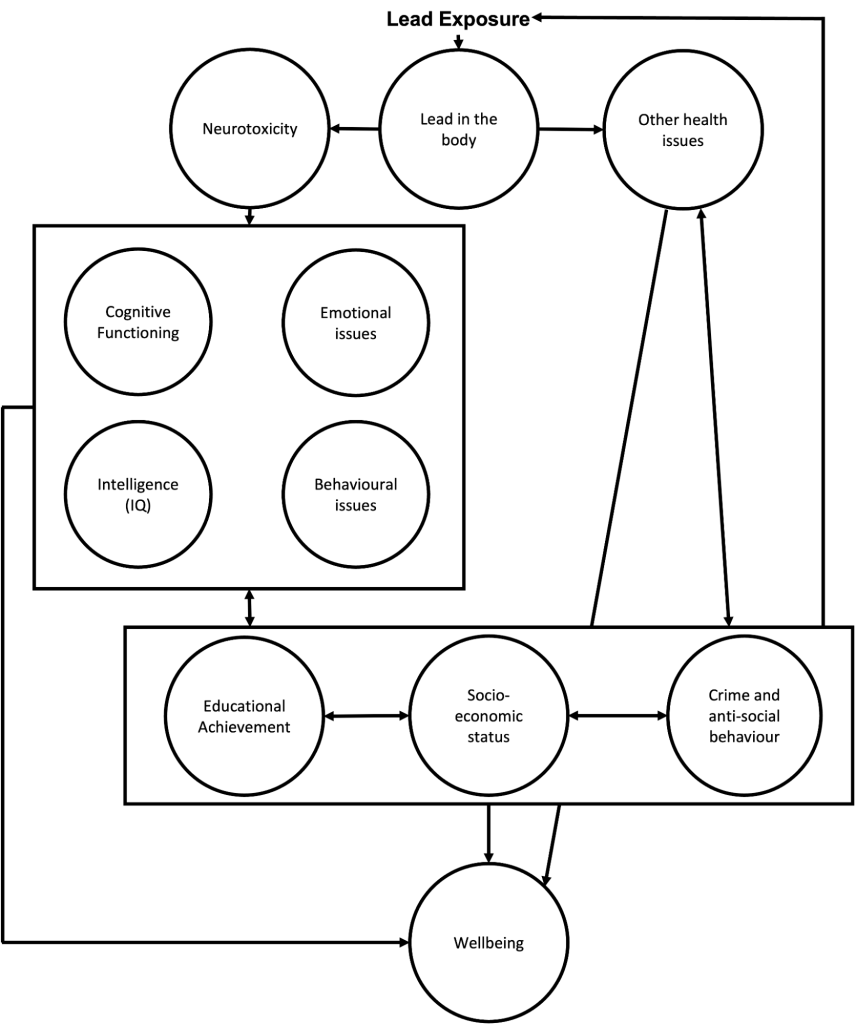
Lead exposure can impact SWB through multiple pathways. Figure 2 provides a visual description of pathways through which lead impacts human wellbeing (inspired by, and expanding on, the figure by Obeng-Gyasi, 2018). In turn, we briefly present the physical and neurological consequences as well as the psychological consequences. We discuss these in the next sections. In Section 6.5 we discuss the socio-economic spillover consequences of lead exposure.
Figure 2: Mechanisms for lead exposure to affect wellbeing (reproduced from McGuire et al., 2023b).
2.3.1 Physical and neurological consequences of lead exposure
Lead is a heavy metal that is toxic to humans (WHO, 2021). Lead exposure results in lead in the body, which can cause neurodevelopmental damage (Naranjo et al., 2020) as well as physical health problems such as cardiovascular and kidney diseases (Navas-Acien et al., 2007; Boskabady et al., 2018).
Lead exposure also causes neurotoxicity (i.e., damage to the central nervous system; Sanders et al., 2009). Neurotoxicity is particularly problematic for children because their brain is developing and damage during brain development can lead to persistent problems with emotional and cognitive function. This is related to the idea of a critical (or sensitive) period in development, where disruptions to the development of certain processes can permanently impair these processes (Bornstein, 1989; Knudsen, 2004). See Räikkönen et al. (2012) for a mental health focused review of the general topic. There is some evidence that prenatal exposure to lead can impede postnatal mental development (Bellinger et al., 1987). This suggests an ‘earlier the better’ approach to preventing lead exposure.
Lead’s neurotoxicity and adverse health consequences are the likely pathways through which lead impedes children’s development (Neuwirth et al., 2020) and causes adverse psychological and socio-economic outcomes in childhood and adulthood. While we think most of the negative effects of lead exposure come from exposure in childhood, exposure in adulthood also appears related to health (Boskabady et al., 2018) and mental health problems (Yu et al., 2017; Yoon & Ahn, 2016).
2.3.2 Psychological consequences
As a result of neurotoxicity, lead exposure can permanently disrupt cognitive function (Ortega et al., 2021) and intelligence (Counter et al., 2015; Lamphear et al., 2005; Wasserman et al., 1997). Lead exposure is also associated with psychological difficulties such as ADHD (Nedelescu et al., 2022) and behavioural problems (Fruh et al., 2019). It can also have negative effects on personality: Schwaba et al. (2021) utilised a natural experimentSchwaba et al. (2021) used the variation in rollout dates of the clean air act, which reduced atmospheric lead, across counties in the USA. (n = 1,219,29) in which they found that higher lead exposure in childhood made for less conscientious and more neurotic adults. Both personality factors are strongly related to SWB (Anglim et al., 2020, meta-analysis with n = 334,567, studies = 462), suggesting this pathway may have adverse effects on lifetime SWB.
3. Who is doing something? Pure Earth
Pure Earth was founded in 1999 and aims to address lead and mercury poisoning and pollution. Since their inception they have conducted more than 50 projects in multiple countries to mitigate lead exposure. For a list of outcomes from their different projects from 2020 to 2023, see their global lead program report.
Apart from these projects, they also support research through building databases about lead exposure, toxic sites, and collaborating with academics on other technical topics. Two of their most notable projects, which we reference extensively throughout this report, are their Rapid Market Screening (RMS; Sargsyan et al., 2024; Lead in Consumer Goods report, 2023), and Home Based Assessment (HBA; Global Lead Program, 2024).
The RMS was launched in 2021 and analysed lead contamination in over 5,000 samples from consumer goods in markets across 25 LMICs (Lead in Consumer Goods Report, 2023). This was the first analysis of its kind, and provided some rich insight for Pure Earth on where to focus their efforts. For example, in Ghana a total of 193 samples across a range of categories (cookware, cosmetics, paint, etc.) were collected, of which 10% exceeded their relevant reference levelPure Earth uses a relevant reference level to help contextualise the lead concentrations in different products. These reference levels come from existing public health guidelines and regulatory standards from United Nations agencies, the European Union, and the United States. In cosmetics the relevant reference level is 2 ppm (parts per million) of lead. This is taken from the German Office of Consumer Protection and Food Safety. In other words reference levels are like safety cutoffs: they tell manufacturers how much lead is too much for safe use. If a product has more lead than the allowed level, it could be harmful, so the product might get banned or recalled..
However, the presence of lead in a marketplace does not necessarily mean that that same lead will be found in peoples homes. To test this Pure Earth has also carried out the more in-depth HBA in 4 countries (one of which was Ghana with 293 homes). The HBA analyses aspects of the home environment (including soil, paint, indoor dust, water, foods, toys, and other consumer products) reflecting products actively present in a child's home, and thus allowing them deeper insight into the pathways of exposure for children (Home Based Assessment Protocol, 2023).
In this report we focus on one of Pure Earth’s programmes, which aims to eliminate lead from cosmetic products in Ghana.
4. Background for Cosmetics in Ghana
In 2022 a comprehensive blood lead level (BLL) testing initiative, led by Pure Earth Ghana, UNICEF, and the Ghana Health Service, revealed that over 53.5% of the 3,227 children tested across three regions in Ghana had BLLs exceeding the WHO’s intervention threshold of 5 μg/dL (World Health Organisation, 2021). This high rate of lead exposure is attributed to both industrial pollution and contaminated consumer products, with important regional variation.
One notable source of exposure is traditional cosmetics, of which eyeliner is the primary problem in Ghana. While Pure Earth’s intervention is tackling leaded cosmetics in Ghana in general, our modelling and logic primarily focuses on eyeliner.
‘Chilo’ is the Ghanaian local version of ‘kohl’Also referred to as ‘surma’, ‘kajal’, and other names (Ali et al., 1978; Mohta, 2010; McMichael & Stoff, 2018; Lewis, 2022; FDA, 2022)., an eyeliner sometimes composed of ground up lead sulphide, also known as ‘galena’ (Hardy et al., 2008; Filella et al., 2020). When galena is used, lead is not an additive, it is the primary ingredient. The eyeliner is applied to children’s eyes, both male and female, even as young as infants.
How does lead in cosmetics enter the body though? As we understand it, lead can be absorbed through the skin, but that is unlikely to be the primary mechanism through which lead poisoning occurs. Instead, most of the lead enters the body orally through hand-to-mouth contact (Navarro-Tapia et al., 2018). Namely, for eyeliner kids rub their eyes and then touch their mouthNote that although dermal (skin) absorption rate is much lower, application of lead-containing eyeliners is associated with numerous other pathologies such as severe corneal edema, abnormal pigmentation of the conjunctiva, and lacrimal sac and canalicular obstruction (Amry et al., 2011;Hidayat et al. 1997). . The absorption path for other potential leaded cosmetics like lipstick would be even more direct.
While kohl/chilo is especially prevalent in areas with significant Muslim populations, its use is not exclusive to Muslims. Kohl has cultural and historical significance beyond religion in these communities and is often applied for beautification, as well as for perceived protective or health-related reasons, such as warding off evil spirits or protecting children’s eyes (Perry & Eaton, 1991).
Application of chilo (both the leaded and unleaded varieties) is widespread in Ghana. According to Pure Earth’s HBA program, 93% of children assessed in the Northern Region (the area where this issue is the most prevalent) used chilo (Global Lead Program Report, 2024, p. 30).
Eyeliners like these have regularly been found to have elevated lead concentration (Perry & Eaton, 1991; Al-Hazzaa & Krahn, 1995; Al-Ashban et al., 2004; Hardy et al., 2008; Filella et al., 2020; McMichael & Stoff, 2018; FDA, 2022) and regular use has been associated with elevated BLLs (Ali et al., 1978; Sadeq et al., 2021; Hore et al., 2024) across different parts of the world.
For Ghana, of the 28 sampled cosmetic products 7% were found to contain lead above the relevant reference levelIn cosmetics the relevant reference level is 2 ppm (parts per million) of lead. This is taken from the German Office of Consumer Protection and Food Safety. in Pure Earth’s Rapid Market Survey (RMS; Sargsyan et al., 2024; Lead in Consumer Goods report, 2023) and 100% of 8 chilo samples were found above the reference level in their Home Based Assessment (HBA; Global Lead Program Report, 2024)There exists another market survey of cosmetics in Ghana but it had only 21 samples overall (Gyamfi et al., 2023). It is unclear how many of these were eyeliners and what we can conclude from it..
4.1 Why cosmetics in Ghana?
We focus on cosmetics in Ghana for the simple reason it’s what Pure Earth recommended as its best currently unfunded opportunity. Given our limited time available for this evaluation, we thought it reasonable to basically take their word for it. We think this is reasonable because:
1) Pure Earth thinks in terms of cost per reduction in blood lead level (Pure Earth Annual Report 2022/23). Since we model every reduction in BLL as equivalent in wellbeing value (see Section 5), our priorities will be aligned (assuming they do their internal prioritisation in a reasonable manner).
2) As mentioned in Section 1, there are other lead projects run by Pure Earth other than this one. Why out of all of these did we choose their cosmetics programme? Currently, Pure Earth’s seemingly most cost-effective program is removing lead in spices (Pure Earth’s Annual Report 2022/23). Normally this would make it our natural default to evaluate. However, lead in spices has already received a good amount of positive attention in cost-effectiveness analyses (GiveWell, 2021; Porterfield, 2023) and Open Philanthropy recently committed over $1 million to eliminating spices in India (Pure Earth, 2024). Moreover, there are only a limited number of places in the world where lead in spices is an issue, and given the attention received on this issue most opportunities have already been funded, or we expect will be funded soon. We take this as a welcome case where the most cost-effective options are funded first, so cost-effectiveness hits some ‘diminishing marginal returns’. Yet, as we will show, this cosmetics project still seems to be one of the most cost-effective funding options we have found to date (see Section 7). We also chose not to evaluate some of their other projects such as contaminated site clean-up and moving to lead-free pottery as these seem to be significantly less cost-effective than spices according to their Annual Report 2022/23. We think because of the similarities in the theory of change (i.e., advocacy to regulate a common consumer product) cosmetics’ cost-effectiveness will resemble that of spices more than the other sources.
3) Pure Earth already has momentum in Ghana. On August 24, 2023, Pure Earth, in collaboration with UNICEF and the Ghana Health Service, signed a Declaration of National Action to combat lead poisoning in Ghana. Since then, Ghana’s Environmental Protection Agency has closed down two lead acid battery (ULAB) recycling facilities, until they meet Ghana’s newly adopted standards. This indicates that Ghana has some appetite for regulating lead.
4.2 How will Pure Earth remove lead from cosmetics?
To form a view on the plausibility of Pure Earth’s plan, which is more of a qualitative exercise than anything, we need to have a sense of their theory of change. We asked them a series of questions and we are largely paraphrasing their answers below.
They told us that they are attempting to confront the problem by both reducing the supply of lead in the marketplace, reducing demand by consumers, and boosting government capacity to enforce regulations. In more detail the steps they plan to take are as follows.
Supply:
- Conduct an initial supply-chain analysis of chilo eyeliner and other cosmetics to identify how contaminated products enter the country and spread, starting with the main distributors of the most popular brands that have been identified with high lead levels as well as some manufacturers as feasible based upon locationNote that Pure Earth would like to do a more comprehensive regional analysis of leaded cosmetics and their supply chains but does not currently have the budget for this..
- Organise workshops for economic actors in cosmetics in Ghana to inform them about the dangers of lead.
- Try to convince industry actors by providing data on eyeliner contamination and its impact, and also help them with solutions through supply chain analyses, mapping of production, and facilitating technical solutions.
Regulatory:
- Work with Ghana Standards Authority to examine existing regulations on the books for lead in consumer products and whether they need to be updated and/or enforced.
- Build government capacity to enforce existing consumer safety regulations pertaining to contaminated cosmetics.
- Build the government’s enforcement capacity to assess markets and supply chains while acquiring and maintaining necessary equipment, including XRF (X-ray fluorescence) analysers to measure lead concentration levels.
On the consumer side:
- Conduct community awareness activities related to contaminated consumer products including cosmetics and cookware.
Pure Earth have told us that they are fairly certain there are “lead-free eyeliners on the market, but at this point we do not have a good grasp on which specific brands these are nor their price point and availability in the Northern Region of Ghana. Part of our cosmetics market survey that we will be doing under Open Philanthropy will be to gather this type of information” (private correspondence).
Given that only 7% of 28 cosmetic samples in Ghana were found to be above the reference in the RMS and the median level of lead was not detectable we find it highly likely that an alternative will be available. Having said that, 100% of 8 chilo samples were above the reference level in the HBA, so we are slightly uncertain about this. Only time will tell.
However, whether this alternative will be a perfect substitute in terms of quality and price is yet to be seen. If the alternative is not of the same quality, or costs more, then Pure Earth may find more pushback from consumers than in their campaigns to remove lead from spices. We are not too concerned about this as we expect the bulk of the work to be achieved through legislation and elimination of the source, rather than educating consumers and changing preferences because asymmetric information means it would be hard for consumers to detect if the product was truly lead-free, even if that was what they demanded.
5. Relationship between blood lead levels and later in life mental wellbeing
A big part of our modelling of the effect of Pure Earth’s programme (see Section 6), is the link between blood-lead levels (BLLs) and wellbeing. In this section we discuss our model for the effect of early in life BLLs on later in life wellbeing. First, we discuss the evidence we use and how we analyse it in a meta-analysis. Then, we extrapolate from the results of our meta-analysis to the context of our intervention to model what we think the lifetime effect of less lead exposure is in terms of WELLBYs. In this section we also highlight the assumptions of our model, and how realistic we think these are.
5.1 The evidence
The evidence we use in this report is the same as in our previous report (McGuire et al., 2023b), though our modelling of it is slightly different. For ease of reading we summarise the evidence used in the previous report below. For a full description see Sections 3.1, 3.2 and 3.2.1 in the previous report.
We found the evidence linking BLLs to wellbeing is sparseIn McGuire et al. (2023b), we conducted an unstructured search for studies on lead and SWB. The search strategy involved using Google Scholar, Elicit, and Connected Papers, as well as searching through a paper’s references and other papers that cited them. We searched for combinations of ‘lead’ and ‘subjective wellbeing’, ‘happiness’, ‘life satisfaction’, and ‘mental health’.. The evidence we used previously, and in this report, is from two correlational, longitudinal studies: the New Zealand Dunedin cohort (Reuben et al., 2019; n = 579) and the Australian Port Pirie cohort (McFarlane et al., 2013, n = 210; Galletly et al. 2016, n = 158). The studies looked at the relationship between blood lead levels in childhood and later in life mental health. Table 1 below gives some summary statistics for each.
Table 1: Studies used in meta-analysis.
|
Category |
|||
|
Study location |
Dunedin (New Zealand) |
Port Pirie (Australia) |
Port Pirie (Australia) |
|
Observations at follow-up |
579 |
210 |
158 |
|
Original observations |
1037 |
723 |
723 |
|
Attrition rate |
44% |
71% |
78% |
|
Initial testing age (BLLs) |
11 |
7 |
7 |
|
Follow-up testing age (adult outcomes) |
18, 21, 26, 32, 38 (average = 27) |
26.3 |
26.94 |
|
Outcome(s) measured |
Internalising score |
ASR-depression and ASR-anxiety |
CAPE-depression |
It is worth clarifying that while the Port Pirie studies were conducted using the same dataset, the outcomes measured were different. The samples were slightly different because some participants had missing data on one measure or the other.
The results from these two cohorts are mixed:
- Dunedin: Reuben et al. (2019) found that a 5 μg/dL increase in BLLs at 11 years old predicted a significant increase in internalising problems (0.19 SD) such as anxiety, depression, and a sense of loneliness in adulthood.
- Port Pirie: Two studies estimated the effect of an increase in 10 μg/dL at the age of 7 on mental health at the average age of 26-27. McFarlane et al. (2013) found a small nonsignificant increase in anxiety symptoms (0.15 SDs) and a small nonsignificant decrease in depressive symptoms measured by ASR (-0.07 SDs). Galletly et al. (2016), also found a nonsignificant decrease in depressive symptoms as measured by the CAPE scale (-0.32 SDs).
- A decrease in depressive symptoms due to exposure to lead is not an intuitive result, suggesting something has probably gone wrong in the identification method here. The authors suggest the problem may be due to the high attrition rate in both studies (723 original cohort members → 210 in McFarlane et al. (2013) → 158 in Galletly et al. (2016)) which means subtle effects are undetectable.
Beyond just the larger sample size the Dunedin study has a lower attrition rate, and uses a more robust analysis method than the Port Pirie studies as it repeatedly measures the effect at different ages giving it a richer data source in its estimate. The high attrition rate also appears to be non-random in the Port Pirie study children from lower socioeconomic status (SES) backgrounds - who may be more susceptible to the effects of lead exposure - were less likely to be followed up on. While controlling for SES helps mitigate bias, it does not entirely eliminate the possibility that attrition led to a sample that was less representative of the original cohort, particularly in terms of other resilience-related factors not fully captured by SES alone. We do not apply any extra subjective adjustments to our results in the meta-analysis to account for this, but we feel it is important to point out that we are sceptical of the non-significant and unintuitive effects identified in the Port Pirie studies.
Next, we convert these results linearly to represent effects from 1 μg/dL. For example, for the Dunedin study, this would be a 0.19 / 5 = 0.04 SD increase in internalising problems in adulthood per 1 μg/dL during childhood. We assume the dose-response relationship is linear, where each increase of 1 μg/dL in BLLs has the same effect on wellbeingAnother possibility is to model it as logarithmic, where each 1 μg/dL increase in BLLs has a diminishing effect on wellbeing. In a logarithmic model, relative instead of absolute changes in BLLs are what matters. Hence, greater and greater absolute increases in BLLs (e.g., doublings) would be required to inflict the same amount of harm. We did not run this analysis due to limited time.. We guess that a linear relationship seems approximately correct for low BLLs, but we acknowledge that the relationship may be different at higher levels (i.e., >10 μg/dL). One could model the dose-response relationship in a way that suggests slower increases in harm (i.e., reduce our estimate of impact)This would be modelling a logarithmic (or concave or slowing) model. This means each additional unit of the toxin (i.e., lead) increases harm, but by progressively smaller increments. Figure 2 of Reuben et al. (2019), suggests that psychopathology in adulthood increases with BLLs in childhood, but the increase slows above 15 μg/dL, supporting a concave relationship. BLLs also seem to have a diminishing relationship with IQ and socioeconomic outcomes (see Figure 2 ofReuben et al., 2017; and the “Blood lead levels and IQ loss” figure ofSchukraft & Bernard, 2021). or faster increases in harm (i.e., increase our estimate of impact)This would be modelling an exponential (or convex or accelerating) model. This means each additional unit of toxin (i.e., lead) increases harm by a larger margin. At certain levels, bodily defences may be overwhelmed, causing sharper wellbeing declines. It seems plausible that the effects of dosage increases when they reach acute and dangerously poisonous levels (45 μg/dL or more;BMJ, 2022) and cause severe health effects., or a mix of both across dosage. We did not have the time or data to investigate this question in more depth, so we stick to the simpler linear dose-response model.
Combining these effect sizes in a meta-analysisWe use a 3-level multilevel meta-analysis to adjust for the dependency between the multiple effects from the Port Pirie study. See our general methodologyfor more details., we estimate that a 1 μg/dL decrease in BLL in childhood was associated with a 0.016 (95% CI: -0.203, 0.171) SD decrease in affective mental health symptoms later in life (at 27 years old).
Let’s address some concerns with this estimate:
- This is based on longitudinal, but correlational data, not causal data. Although we do not identify any studies looking at subjective wellbeing or mental health which use causal identification strategies, we did find three studies looking at other adult outcomes which use causal estimates and find significant results (Nilson, 2009; Grönqvist et al., 2017; Keyes et al., 2023). Furthermore, we have peeked at some promising preliminary findings which used a causal identification strategy to detect the relationship between childhood lead exposure and adult mental health. The study used a much larger sample size and found a much larger and significant relationship between the two variables. Nonetheless, given these results are only preliminary and the authors have asked us to not to publicise them, we do not include them in our meta-analysis, though they do update our beliefs that the results we currently rely on are in the right direction, but even potentially a lower bound. We discuss our concerns about causality and an adjustment we apply to account for these concerns in Section 6.4.1.
- This is a small and non-significant result. This is a limitation of this analysis, which is why we put an emphasis on conducting more research in Section 9. Nevertheless, taking this outcome at face value still leads to a highly cost-effective programme (see Section 7).
- These results are on affective mental health outcomes rather than classical subjective wellbeing outcomes (e.g., life satisfaction, happiness). This assumes that these two sorts of outcomes are capturing similar constructs. Or, at the very least, that using MHa measures does not overestimate our results. We argue that this is the case empirically and theoretically in a separate report (Dupret et al., 2024).
Next we discuss how we use this estimate to model the total effect over time of being exposed to lead on a person’s wellbeing.
5.2 Modelling the total effect over time
At its core, the model of the total effect over time is the following:
- People are exposed to lead during childhood.
- People accumulate losses in wellbeing due to exposure during childhood (through the causal pathways mentioned in Section 2.3).
- These losses accumulate from childhood to a certain point in adulthood where they stabilise.
- This loss in wellbeing is then experienced over the rest of the life span.
First we discuss the modelling decisions and the assumptions that come with them. Then we represent the model in formal calculations.
5.2.1 Modelling decisions and assumptions
There are several important assumptions and modelling decisions we make to extrapolate the estimated effects of reductions in blood lead levels. In each of these we try our best to make reasonable, simple, and conservative assumptions. These assumptions and modelling choices are:
1) At whichever age a person starts being exposed (or, rather, stops being exposed in the case of interventions), the burden of lead on their wellbeing starts increasing linearly. It is very plausible that this relationship over time might not be linear, but this is the simplest assumption to make in this model.
2) This burden stops increasing at 27 years old. This is an unverified assumption on our part that the biological, cognitive, social, and economic losses of lead exposure in early life stabilise and lock-in at that particular age. We choose this age because it is the average follow-up age of the studies in our meta-analysis. This means it is a conservative estimate because we know that the effects reach this level, but there is obviously a chance they continue to accumulate further.
3) Then the burden stabilises and continues until the individual’s death, at the average life expectancyFor simplicity we just use the most recent data point for Ghana’s life expectancy which is 63.8 years (OWID). Note that this life expectancy is the ‘period life’ expectancy (i.e., how long someone born today is expected to live given current mortality trends). This means that future improvements in medical technology, economic growth etc., are not factored into this life expectancy figure. In the future we plan on exploring some different options to adjust for what we think the true life expectancy of someone born today is. However due to time constraints we do not attempt this in this report.. In other words, adults do not adapt to the consequences of earlier exposure. We imagine this is likely because factors like lost opportunities, a lower IQ, and lower income will set people off on a different, lower wellbeing life course. Thus we would not expect adaptation. In Appendix A.1 of our previous lead report (McGuire et al., 2023b) we explore some other possible trajectories.
4) All of which is multiplied by the BLLs of exposure (or reduced in exposure in the case of interventions). This implies a linear relationship between childhood exposure and the effects on adult mental health outcomes. Again it is plausible this relationship is not linear, but it is the simplest assumption to make in this model (see 5.2.1 for more detail). In the calculations below, we use a simple case of 1 μg/dL.
5) We exclude any consideration of the effect of lead exposure during adulthood on adult wellbeing. This is because we did not find sufficient evidence to model this part in a timely manner (see McGuire et al., 2023b, for more discussion). We are not concerned about this as it just means our estimate will be a lower bound.
6) We consider the first 0-10 years of age to be ‘childhood’. If someone is exposed to lead during these first ten years, we consider them to be affected by lead. We adjust the effect proportionally to the extent of time exposed in childhood (e.g., the effect would be only 50% if they are exposed for only 50% of childhood). This is admittedly a simplistic assumption, but we did not have enough time to build a complex model of childhood exposure.
5.2.2 Formal calculations for our modelling
We estimated that 1 μg/dL of lead in childhood leads to a reduction in 0.016 SDs of wellbeing by age 27. We assume the effect increases linearly to that point, so it would increase by 0.016 / 27 = 0.0006 SDs per year. This represents a triangle of wellbeing loss. Then the 0.016 SDs reduction of wellbeing at 27 is stable until the end of life, in our case until 63.8 years of age (the life expectancy in Ghana; OWID). This represents a rectangle of wellbeing lost. We integrate over the whole area lost to calculate the total effect lost over the years in SD-years of wellbeing:
\(\text{total effect} = (\text{burden}_{\text{at age 27}} \times 27 \times 0.5) + (\text{burden}_{\text{at age 27}} \times (LE - 27))\)\(\text{total effect} = (0.016 \times 27 \times 0.5) + (0.016 \times (63.8 - 27))\)\(\text{total effect} = 0.216 + 0.588 = 0.805\)Hence, the total effect for 1 μg/dL of lead in childhood is a loss of 0.805 SD-years of wellbeing.
We want to convert this to wellbeing adjusted life-years (WELLBYs), where 1 WELLBY is the equivalent of a 1 point increase on a 0-10 wellbeing scale over a year (or equivalent). To do so we follow our typical procedure (see the methods section of our website for more detail) where we multiply the effect in SD-years by our estimate of the typical SD on a 0-10 wellbeing scale, in this case, an average SD of 2 points on the Cantril Ladder scale (based on the Gallup World Poll data: 1704 observations from 165 countries from 2005-2018 with a total sample of respondents of about 1,704,000). Therefore this is equivalent to a 0.805 SD * 2 = 1.61 WELLBY decrease.
We represent our model, in WELLBYs, in Figure 3 below. The shaded red area is the total effect.
Figure 3: Basic model of effect of 10 years of childhood exposure on lifelong wellbeing.
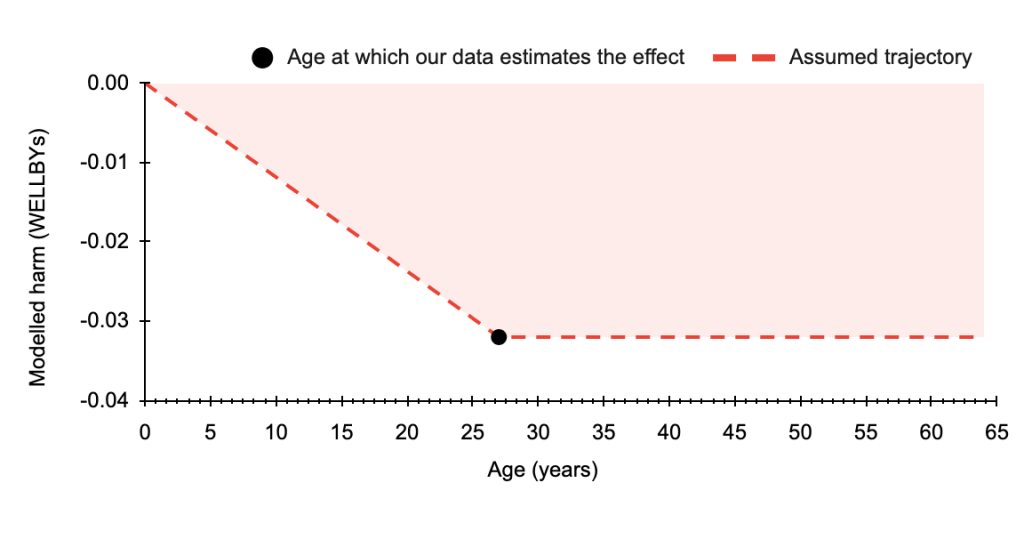
Note that we invert this negative effect when we consider the good that an intervention reducing lead exposure does. Namely, this 1.61 WELLBYs loss becomes 1.61 WELLBYs gained if the intervention prevents exposure to 1 μg/dL from birth.
The 1.61 WELLBY gained for an intervention that prevents exposure of 1 μg/dL during childhood is assuming the intervention reduces exposure during the whole 10 years of childhood. If an intervention only reduces BLLs by 1 μg/dL for 5 years (half of childhood) then we expect it will have half the lifetime effect: 1.61 * 0.5 = 0.81 WELLBYs.
6. Wellbeing effect of the cosmetics project
In this section we attempt to estimate the total WELLBYs we expect to be produced by Pure Earth’s cosmetic intervention. Ideally, we would base our analysis on causal studies that show the long-term impact on wellbeing from Pure Earth intervening in an area. This evidence does not exist, so instead we estimate this effect by combining three sources of less certain evidence:
- information about lead levels due to cosmetics in Ghana.
- a prediction of how much Pure Earth will reduce this exposure (based on advocacy, which is generally more uncertain to model).
- a general link between blood lead levels and wellbeing.
We discussed the modelling of the general link between BLLs and wellbeing in Section 5. Here we discuss the other elements of our modelling:
- Section 6.1: How much we think this campaign is likely to lower the BLLs of children in using:
- Average BLLs of children in Ghana.
- Percentage of these BLLs can be attributed to lead exposure from cosmetics.
- What percentage of lead exposure from cosmetics Pure Earth will be able to eliminate.
- Section 6.2: The counterfactual years gained compared to when the Ghanaian government might have enforced such a reduction in the future without Pure Earth’s intervention.
- Section 6.3: The total effect on an individual's wellbeing over time from this intervention, combining information from Sections 5, 6.1, and 6.2.
- Section 6.4: Adjusting the total effect for internal and external validity.
- Section 6.5: Adding spillovers.
- Section 6.6: Calculating all the WELLBYs gained for all the children impacted.
6.1 How much do we expect the removal of lead from cosmetics in Ghana to reduce the BLLs of Ghanaian children?
6.1.1 What are the current blood lead levels of children in Ghana?
We estimate that the average BLL for the 9,162,721 children (i.e., under 10 years old) in Ghana (UNDP) is 4.001 μg/dL (IHME, 2021). To calculate this we used the IHME (the Global Burden of Disease) data from 2021 that has BLL estimates across countries. IHME presents results in different age ranges (e.g., “5 to 9” years old). We calculate an average BLL for children 10 and younger by weighting each BLL score per age range according to the number of people in these age ranges (according UNDP population data).
This is lower than the results of Pure Earth’s BLL survey (p. 24), which looked at 3,227 children in Ghana and found the average BLL was 8.0 μg/dL.
Which of these two sources should we choose to determine our estimate?
On the one hand, the IHME is a well recognised authority for global health statistics. Their estimates of the BLLs are based on 555 sources from countries all across the globe (GBD, 2021; Larsen & Sánchez-Triana, 2023). However, there is not exact data for each place and age range, so their estimates involve modelling. This makes it difficult to do a simple comparison between their estimate and the Pure Earth estimate. Our brief exploration, which could very much have missed something, suggests that the estimates for BLLs in Ghana are likely more reliant on modelling from other sources than sources directly in Ghana. The sources can be downloaded here, there are only two sources in Ghana and they seem to be very limitedOne is old and we cannot access details, but looks at 11 to 15 year olds (Ankrah et al., 1998). The other looks at 15+, mainly adults, waste workers with a tiny sample (n = 75; Wittsiepe et al., 2017)..
The Pure Earth data also has issues though. The selection process was not random as participants were chosen based on whether they were located near ULAB-sites. This means selection bias has likely pushed up the average BLL levels.
We choose to take a simple average between the two sources due to our uncertainty, which is 6.0 μg/dL.
6.1.2 How much of total lead exposure stems from cosmetics in Ghana?
Pure Earth has been working in Ghana for the past three years. Most of this work was primarily gathering data on sources of lead exposure. Ghana is one of the four countries in which they have carried out not only a Rapid Market Screening (RMS), but also the more detailed Home Based Assessment (HBA). We reference these projects extensively throughout this report, are their Rapid Market Screening (RMS; Sargsyan et al., 2024; Lead in Consumer Goods report, 2023), and Home Based Assessment (HBA; Global Lead Program, 2024).
The RMS was launched in 2021 and analysed lead contamination in over 5,000 samples from consumer goods in markets across 25 low and middle income countries (Lead in Consumer Goods Report, 2023). This was the first analysis of its kind, and provided some rich insight for Pure Earth on where to focus their efforts. For example, in Ghana a total of 193 samples across a range of categories (cookware, cosmetics, paint, etc.) were collected, of which 10% exceeded their relevant reference levelPure Earth uses a relevant reference level to help contextualise the lead concentrations in different products. These reference levels come from existing public health guidelines and regulatory standards from United Nations agencies, the European Union, and the United States. In cosmetics the relevant reference level is 2 ppm (parts per million) of lead. This is taken from the German Office of Consumer Protection and Food Safety. In other words reference levels are like safety cutoffs: they tell manufacturers how much lead is too much for safe use. If a product has more lead than the allowed level, it could be harmful, so the product might get banned or recalled..
However, the presence of lead in a marketplace does not necessarily mean that that same lead will be found in people’s homes. To test this Pure Earth has also carried out the more in-depth HBA in 4 countries (one of which was Ghana with 293 homes). The HBA analyses aspects of the home environment (including soil, paint, indoor dust, water, foods, toys, and other consumer products) reflecting products actively present in a child's home, and thus allowing them deeper insight into the pathways of exposure for children (Home Based Assessment Protocol, 2023).
Pure Earth estimates how much of the BLLs in Ghana are attributable to different important sources of household exposure: foods, cosmetics, paint, etc., in an internal tool they call the Lead Impact Model (LIM) which collates and organises much of their researchThey have asked us not to share this tool publicly, although they gave us access privately.. Based on the data from the RMS, Pure Earth estimates that 9.4% of all BLLs in Ghana stem from cosmetics. These results are based on only 28 samples of cosmetics. They also have a second estimate, much higher estimate, of the lead burden of cosmetics which they derive using their HBA data. We discuss these results and why we have chosen the RMS estimate instead in Appendix A.
It is also worth noting that the 9.4% of total exposure reported in the LIM, is only for exposure within the household. We asked Pure Earth what percentage of exposure they expect to come from non-household sources (i.e., sources not considered in the LIM). They were unsure of the answer, but guessed around 20% of total exposure. We think this is potentially a little low, since non-household lead sources include things like air pollution, contaminated soil and drinking water, but honestly we are not sure because there simply is not enough data to come to a better estimate. To be conservative we assume 30% of total exposure is from non-household sources. In other words, the percentage of total exposure due to cosmetics is 9.4% * 0.7 = 6.6%
Hence we calculate, 6 μg/dL * 6.6% = 0.40 μg/dL of total BLLs per child are due to lead in cosmetics in Ghana.
We explain how Pure Earth estimates that 9.4% of household exposure is from cosmetics in Ghana and some limitations of this approach in Appendix B. Note that while Appendix B shows that Pure Earth’s modelling is far from perfect and based on some large guesses and assumptions, we think this is a more reliable and conservative estimate than alternative modelling we could have used which we show in Appendix C.
6.1.3 How much will Pure Earth lower BLLs as a result of their cosmetics project?
See Section 4.2 for how Pure Earth plans to remove lead from cosmetics in Ghana. The upper bound effect is going to be removing the entire lead exposure attributable to cosmetics in Ghana (i.e., 0.40 μg/dL per child). While we think they will have some success, we doubt they will eradicate all lead from cosmetics. But how much will they do? We have to guess.
This is one of the most uncertain, and influential variables in this analysis. To try and limit the impact of one researcher’s guess we took an average across three of the authors of this paper. The average of our conservative guesses was 38%These quick and uncertain guesses were 50% (Ben), 25% (Joel), and 45% (Samuel).. Note that in this guess we are also trying to account for the fact that this project might completely fail. With more time and data we would produce a more sophisticated estimate.
The best reference we have is two campaigns to remove lead from spices in two countries, Bangladesh and GeorgiaIn comparison projects like Pure Earth’s clean up of contaminated sites seem much less relevant.. Both spices and cosmetics:
- Require advocacy to first change the law, and then monitoring to ensure enforcement.
- Are typically sold to consumers by small, often informal, vendors at bazaars or markets, but have more centralised sources for the raw materials.
Although this only represents two data points, both of these projects were very successful.
- Bangladesh: From 2019 to 2021 it was found that lead in market samples reduced from 47% (211 samples) to 0% (87 samples) and the percent of mills with direct evidence of lead chromate adulteration (pigment on-site) decreased from 30% (of 33 mills) to 0% (of 21 mills) (Forsyth et al., 2023).
- Obviously Ghana and Bangladesh are very different contexts. That said, they have similar levels of income (OWID, 2024) and state capacity (OWID, 2024).
- Georgia: From 2020 to 2022 the percentage of spices with lead levels above the reference level reduced by 86% (Forsyth et al., 2024).
Note that Pure Earth did not directly participate in the Bangladesh project by Forsyth, colleagues, and the Stanford University, but have since then developed projects in India to tackle lead in spices. Pure Earth did contribute to the Georgia project.
These imply that we might be being conservative with our guess of 38%. If we naively take the average of the success rates (100% and 86%) in the case studies above, advocacy projects like Pure Earth’s have historically reduced the percentage of spices with lead levels above the reference level by 93%.
However, the 100% success rate in Bangladesh is not saying that 100% of lead was removed, but that 100% of tested products were below the reference level. An important factor therefore is how far above the reference level products were on average before advocacy work. We don’t have access to this data, but we can see that the maximum detected before and after the interventions. In Bangladesh the maximum fell from 835 μg/g to undetectable and in Georgia from the maximum level detected fell from 14,233 → 36 μg/g (a 99.7% reduction). Again this implies that our assumption that Pure Earth’s work will only reduce the total exposure to lead from cosmetics by 38% is conservative.
We can also look at LEEP’s success at reducing lead in paint as it follows a similar advocacy model. Before convincing the Malawian government to enforce regulations against lead paint, 67% of samples were leaded. This dropped to 24% in 2023 (LEEP, 2023), a 43 percentage point or 65% relative reduction. This was driven by the most popular paint brand making the switch. However we think this is less relevant for the following reasons:
- The market for cosmetics and spices seems less centralised than for paint. Making paint is an industrial process that benefits from economies of scale.
- Making and selling spices or cosmetics like chilo seems to be much more homespun than paint. In the case of cosmetics, this is evidenced by the fact that there appear many recipes to make makeup like chilo or kohl from home. Nevertheless, people still need to buy the lead sulphide, which Pure Earth will be targeting in the supply chain.
- LEEP carried out this work rather than Pure Earth, so there could also be differences in implementation techniques which lead to this lower rate of elimination
The success of Pure Earth and LEEP at reducing lead in spices and paint is encouraging. However we still have some concerns about how successful this campaign will be:
- This is Pure Earth’s first attempt to regulate a cosmetic product, thus there may be some unknown unknowns.
- We have only looked at three data points for similar interventions (spices in Bangladesh and Georgia, as well as paint in Malawi).
- A very decentralised production environment (which seems plausible in this case) is very hard to regulate. Although this is also the case for spices.
- Widespread education campaigns are probably going to be limited in effect. Especially if there is no reliable way of verifying which brands of chilo are lead-free.
Despite these concerns we think our assumption of a 38% reduction in the lead exposure from cosmetics is still conservative. In Section 9 we will relax how conservative we are and explore how this impacts cost-effectiveness.
6.2 What is the counterfactual? When would we expect lead levels to have reduced anyway?
The policy and the subsequent regulation enforcement might have been implemented in the future without Pure Earth’s intervention. We need to determine how many years the policy has been brought forward by the intervention.
Both our previous analysis of leaded paint interventions and Kate Porterfield’s (a Pure Earth analyst) preliminary CEA of reducing lead in turmeric in Bangladesh used a 8 years (beyond the time to implement the intervention) figure. This comes from LEEP’s CEA of preventing lead in paint in Malawi; however, LEEP acknowledges that “This timeframe is a guess - we are not sure how long it otherwise would have taken for someone to test the paint and bring it to the attention of the government”. GiveWell uses a similar 7 year counterfactual estimate, which is a subjective downward adjustment from their 10 year default guess. For simplicity, and due to time constraints, we use the industry standard of an 8 year counterfactual as our starting point.
Note that in Appendix D we explore some historical cases to try and get a sense of how quickly regulations have been implemented without advocacy historically. These suggest that the counterfactual years could be much higher, making the 8 year guess a conservative approach. However, we did not have time to do a comprehensive enough review of historical cases or work out how to combine these historical cases into a defensible number. Thus, we decided to stick with what others have used, because it seems conservative, and helps comparability between reports. In the future, we hope to return to this work and produce a more evidence-based number, rather than rely on a guess.
So, we use 8 years as our starting point for how much we think advocacy to a government will move the counterfactual forward. But, as discussed in Section 5, Pure Earth has been running lead advocacy programmes in Ghana for the past 5 years. These have already led to law changes and two ULAB sites being closed down until they meet regulatory requirements. Therefore, we think that, in this case, the Ghanaian government already seems committed to the lead problem.
This is not to say that we think the Ghanaian government regulating cosmetics is a given without Pure Earth’s advocacy and technical support. There is a very real chance the government could decide that without Pure Earth’s assistance eliminating lead would become too expensive and the momentum built would count for nothing. Nonetheless, it seems prudent to assume that Ghana is likely to regulate cosmetics sooner than a country which has had no previous involvement with Pure Earth. Given 5 years of advocacy on lead issues in general in Ghana has already been carried out and we expect Pure Earth to do a further 5 years on cosmetics (2 more years of cosmetic specific advocacy and 3 years of monitoring and enforcement), we crudely guess the counterfactual to be (5/10) * 8 = 4 years. In other words, 5 of the 10 total years (i.e., half) of the work has already been completed, so we adjust the 8 year figure used in LEEP’s analysis to 4 years reflect thisIt may seem strange to have a counterfactual of 8 years when we think it is 10 years of work to get there, but this 8 years refers to the time on top of the 10 years we think the intervention will take. See Appendix D for discussion of alternative counterfactual times..
This implicitly assumes that all years of advocacy (i.e., including the general advocacy) are equally important in determining the outcome of the cosmetic-related advocacy. We find this unlikely for two reasons. First, it seems probable that the 2 cosmetic-specific advocacy years would be more important than the previous 5 years of general advocacy. Second, when we take data about lead paint regulations (OWID) and share of paint samples with high lead content (OWID), the difference is not too large between countries that do and do not have regulations (58% → 46% of paint with lead, n = 56 countries). So it appears enforcement may be even more important than advocacy. Therefore, our assumption that all years are equal, and therefore approximately half the work has already been done, appears a conservative choice. On the other hand, one might argue that the general years of advocacy were necessary to pave the way and get the government invested in solving the lead problem in their country, thereby, making these years very important as well.
6.3 Individual level wellbeing results
We have the basic inputs we need to model the individual level effects.
- The effect per decrease in 1 BLL across childhood (the first 10 years of life) is 1.61 WELLBYs over the child’s lifetime.
- We estimate the BLLs from cosmetics to be 0.40 μg/dL.
- We guess that the technical assistance Pure Earth provides will decrease lead from cosmetics by 38%, so 0.40 * 38% = 0.15 (or decrease BLLs from 4 to 3.76 μg/dL).
- This 0.15 BLL decrease will effectively “last” for 4 years in our model due to our guess at what the counterfactual isIt is worth noting that moving the date lead is removed from cosmetics forward by 4 years, technically does not mean that everyone under 10 experiences exactly 4 years less lead exposure. For example, due to the way we have modelled this we assume that beyond the age of 10, further exposure to lead causes no further harm. Therefore, even if the counterfactual is 4 years, a 9 year old would only benefit from 1 less year of exposure. On the other hand, a child born one year after the lead is removed, would have counterfactually experienced lead exposure from cosmetics for the first 3 years of their life. The difference between modelling this way and simply just using the number of children under 10 currently alive and assuming they experience 4 years less of exposure is relatively small due to the former modelling choice having counteracting forces of a larger population being affected, but for a shorter average period. We used both models for a range of counterfactual years and found the differences were marginal. For simplicity we therefore just assume everyone under 10 experiences exactly 4 years less lead exposure..
- This effectively implies a 1.61 WELLBY * (4 years/10 years) * (0.15 BLL) = 0.098 WELLBY increase per child affected by the policy in Ghana.
This is our unadjusted estimate. But we are using correlational evidence that may have replicability and generalisability concerns. We turn to those next.
6.4 Validity adjustments
We consider validity adjustments to account for three issues:
- non-causal evidence
- internal validity (i.e., replicability or ‘how different would the study be if replicated under ideal conditions?’)
- external validity (how does the evidence generalise to the context of concern?)
We apply these adjustments to the effect.
6.4.1 Causality concerns
In this section we draw heavily from Section 3.2.2 of our previous report (McGuire et al., 2023b).
We have two concerns about the correlational data we use. First, there is the possibility that other variables could be causing both increases in lead exposure and decreases in wellbeing (i.e., there are confounding variables). However, we believe this is unlikely to explain away all the effects because the Dunedin cohort (Reuben et al., 2019) and the Port Pirie cohort (McFarlane et al., 2013; Galletly et al., 2016) studies did control for family variables like parental MHa and socioeconomic status. Although note that (1) controlling for variables does not entail causality and (2) there could be potential unobservable variables they did not control for that could confound the results.
The second possibility is that of reverse causation, where lower subjective wellbeing leads to greater lead exposure. Are happier children less likely to be given leaded cosmetics?
However, we have some reason to think reverse causation is not too likely. In many countries, BLLs have been declining for the past few decades (USA: Tsoi et al., 2016, Mexico: Pantic et al., 2018, worldwide: Hwang et al., 2019). In Australia and New Zealand, the countries we have longitudinal data on, the average BLLs of children surveyed in the 1980’s was 11 and 17 μg/dL, respectively. Recent surveys of adults in the 2010s in Australia (Kelsall et al., 2013) and New Zealand (Mannetje et al., 2020) found BLLs of adults were around 1 μg/dL. If these studies generalise to the longitudinal studies we use, then that suggests a reduction in BLLs over time of 90-94%.
If lead exposure had remained high throughout life, there might be more concern that people with lower wellbeing could be more likely to expose themselves to lead, either through living in polluted areas or other risky behaviours. However, given lead exposure has decreased, the fact we still observe long-term effects on wellbeing from childhood exposure suggests that the harm is primarily caused by that early exposure rather than adult behaviour or ongoing exposure. This supports a causal interpretation where childhood lead exposure, not later behaviour or conditions, is the key driver of reduced wellbeing.
Since the previous report we have also peeked at some preliminary findings which used a causal identification strategy to detect the relationship between childhood lead exposure and adult mental health. The study found a childhood lead exposure had a significant effect on adult mental health and wellbeing and suggested the relationship was over 3x bigger than we found in our meta-analysis. The sample size used to detect this effect is also over an order of magnitude greater than the total number of observations used in our meta-analysis. Nonetheless, given these results are only preliminary and the authors have asked us to not to publicise them, we do not include them in our meta-analysis.
Although the preliminary study discussed is the only one using a causal identification strategy focused specifically on wellbeing, we have identified three other papers that leverage quasi-random natural experiments to examine the effects of childhood lead exposure on adult outcomes, including income, labour market outcomes, cognitive functioning, and crime (Nilson, 2009; Grönqvist et al., 2017; Keyes et al., 2023). Since these factors likely influence wellbeing, we believe that stronger data from causal identification approaches will reinforce the correlational findings, confirming a link between childhood lead exposure and later-life wellbeing.
In our previous lead report we used an adjustment 0.70. The new preliminary causal results update us a little further and we reduce our discount to 0.75 (i.e., a 25% discount).
6.4.2 Replication
We apply our standard 0.51 replication adjustment. This is a somewhat subjective adjustment which corresponds to our general and sceptical prior that many results do not replicate. Nosek et al. (2022) reports on multiple replication efforts in psychological sciences: Camerer et al. (2018, k = 21), Open Science Collaboration (2015, k = 94) and the Multi-Lab studies (1,2,3,4; k = 77). For each, there is an original effect size and a replication effect size, so we can calculate how large the replication effect is compared to the original effect (i.e., a proportion). We take a weighted average of these proportions, which suggest that replicated effects are 51% of the magnitude of the original effects.
6.4.3 External validity
The evidence we use is from individuals who grew up in New Zealand (Reuben et al., 2019) and Australia (McFarlane et al., 2013; Galletly et al. 2016) in the 1970s-1980s . Is the lead-wellbeing relationship stronger or weaker in LMICs?
To try and form a view on this (there’s no empirical evidence we can rely upon), we need to imagine a causal model for the lead to wellbeing relationship. Take IQ. We are fairly confident that lead exposure reduces IQ (Lanphear et al., 2005; Nilson, 2009; Grönqvist et al., 2017; Heidari et al., 2022; Keyes et al., 2023; Larsen & Sánchez-Triana, 2023). Indeed, it is one of the primary channels that researchers model harm from lead through (see Larsen & Sánchez-Triana, 2023, for an expansion to the typical modelling by using cardio-vasculary diseases). Let’s imagine that higher IQ causes higher wellbeing through higher income. If the primary channel is higher income, then it seems plausible that the IQ-income relationship is weaker in LMICs where there’s a lower share of white collar work (which seems to be more cognitively demanding in many cases). This is one possible concern.
We honestly are not sure, so we apply a 0.50 adjustment out of an abundance of caution.
6.4.4 Adjusted effect
Applying these adjustments, the adjusted per person wellbeing effect is 0.098 WELLBYs * 0.75 * 0.51 * 0.50 = 0.019 WELLBYs.
6.5 Household and community spillover effects
We rely heavily on Sections 2.3 and 3.2.4 of our previous report (McGuire et al., 2023b).
We do not have data that would allow us to produce an estimate of spillovers for lead. Additionally, our general impression is that researchers fail to consider, collect, and report spillover effects; hence, we wouldn’t be surprised there are gaps in the evidence. However, we do think it is plausible that there are spillover effects for preventing lead exposure. Spillovers are an important part of our modelling and we want to include this.
We impute the 16% household spillover ratio from our psychotherapy analysis (McGuire et al., 2024b). We think it is plausible that they would affect households in similar pathways, at the very least through emotion contagion: People living with people that are less happy will also tend to be less happy.
We do not want to risk double-counting spillover effects. It is likely that if siblings have the same source of lead exposure, then the wellbeing of reducing their lead exposure will already include the benefits of each sibling not having reduced wellbeing. This is just a quirk in our data because lead exposure will be impacted at the community level, rather than individual level. Nevertheless, it is very likely that there are spillovers on the parents of having their children’s wellbeing reduced because of lead exposure. Therefore, we set the household size affected by spillovers to 2.
This leads to an overall effect on the household of: 0.019 + (0.019 * 16% * 2) = 0.025 WELLBYs.
We think it is plausible that the spillovers are higher than this, and that this includes community spillovers. We briefly discuss some related evidence below.
Nakata et al. (2021) observed that the BLLs of children were correlated to lower mental health levels in mothers, over and above the effect of the mothers’ BLLs on their own mental health. There is tentative correlational evidence suggesting household and community spillover effects of lead exposure related to crime and education. In a meta-analysis of the correlations between lead exposure and crime rates, Higney et al. (2021; studies = 24) estimate that between 0% and 36% of the reduction in crime seen in the USA in the last few decades is due to a reduction in lead exposure. Crime seems intuitively and empirically related to the wellbeing of a community (Baranyi et al., 2021)They find a meta-analytic correlation of r= 0.04 (95% CI: 0.03, 0.06) between local crime rates and depression. If we convert this correlation to Cohen’s dthis returns a Cohen’s dof 0.08 (using https://www.escal.site/). Close to the average impact of receiving a cash transfer (McGuire et al., 2022). We would interpret this as making crime levels go from the highest to the lowest in the sample, but we are unsure if that is sensible. . Gazze et al. (2021) also find that “Having more lead-exposed peers is associated with lower high-school graduation and SAT-taking rates and increased suspensions and absences”They assume that lead exposure leads to worse school performance, which influences peers to do worse: “analysis approach seems rather suggestive by its emphasis on siblings "We compare siblings whose school-grade cohorts differ in the proportion of children with elevated BLLs, holding constant school and peers’ demographics. Having more lead-exposed peers is associated with lower high-school graduation and SAT-taking rates and increased suspensions and absences. Peer effects are larger for same-gendered students.".
6.6 Overall wellbeing benefit
We estimate the overall wellbeing effect by multiplying the adjusted per person effect by the total population of those in Ghana under 10: 9,162,721 (UNDP). Therefore total WELLBYs produced is 0.025 WELLBYs * 9,162,721 = 226,702 WELLBYs. We summarise the key inputs and calculations for the total wellbeing effect below in Table 2.
Table 2: Overall wellbeing effect
|
Parameter |
Value |
Unit |
|
How much do we expect the removal of lead from cosmetics in Ghana to reduce the BLLs of Ghanaian children? |
||
|
% from cosmetics [adjusted] |
6.59% |
% |
|
Average BLLs in Ghana for <= 10 y.o. |
6.0 |
μg/dL |
|
Average BLLs in Ghana for <= 10 y.o. that comes from cosmetics. |
0.40 |
μg/dL |
|
How much will Pure Earth reduce? |
38% |
adjustment factor |
|
Reduction in under-10's BLLs in Ghana from project [adjusted] |
0.152 |
μg/dL |
|
Lifetime effect on wellbeing due to reduction in BLLs for under-10s in Ghana |
||
|
Total lifetime effect on individual for exposure to 1 BLL less during childhood (= 0-10 years old) |
1.61 |
WELLBYs |
|
Counterfactual years [adjusted and attributed] |
4 |
years |
|
Total lifetime effect on individual for exposure to 1 BLL less during childhood (= 0-10 years old) adjusted for years of childhood exposed |
0.64 |
WELLBYs |
|
Total effect adjusted for no. of years less exposure and reduction in BLLs for those years |
0.10 |
WELLBYs |
|
Validity-adjusted lifetime effect on wellbeing for under-10s in Ghana |
||
|
Causal adjustment |
0.75 |
adjustment factor |
|
Replicability adjustment |
0.51 |
adjustment factor |
|
Generalisability adjustment |
0.50 |
adjustment factor |
|
Total adjustment |
0.19 |
adjustment factor |
|
Adjusted individual life time effect |
0.019 |
WELLBYs |
|
Lifetime household wellbeing effect |
||
|
Spillover ratio |
16% |
% |
|
No. of non-recipients affected by spillovers per household |
2.00 |
people |
|
Overall effect on household per 1 BLL adjusted for exposure (WELLBYs) |
0.025 |
WELLBYs |
|
Total WELLBYs produced by intervention |
||
|
Population in Ghana under 10 |
9,162,721 |
people |
|
Overall WELLBYs produced |
226,702 |
WELLBYs |
7. Cost and cost-effectiveness
7.1 Cost
Pure Earth has told us that the technical support portion of this project will cost a total of $1.8 million. This is $300k for two years of advocacy and support to bring in regulations and collect the data necessary to format a strategy, and then a further 3 years of monitoring at $400k per year to ensure the regulations are successfully enforced.
This does not include the overhead costs (administration and fundraising) included in the running of Pure Earth though. To account for this we inflate this cost by the percentage of total costs ($8,089,140) made up by non-programme costs ($1,317,788) in their 2023 audited financial statement. Namely, this represents an overhead cost of 16.29%, leading to an adjustment of 1.19, afterwhich the total costs are $2,150,302.
7.2 Cost-effectiveness
Now that we have the total WELLBYs generated and the cost to generate them, we can estimate the cost-effectiveness of this project. We calculate the cost-effectiveness to be 1000 * 226,702 WELLBYs / $2,150,302 = 105 WELLBYs per $1,000 (WBp1k), or $9.49 to produce a WELLBY.
The takeaway is that even with an intentionally tilting conservative analysis, this still seems like a highly cost-effective opportunity. See Table 3 below for our results and here on the website to compare this to other opportunities.
Table 3: Cost-effectiveness of Pure Earth’s Cosmetic project in Ghana
|
Parameter |
Value |
Unit |
|
Total benefits and costs |
||
|
Overall WELLBYs produced |
226,702 |
WELLBYs |
|
Adjusted cosmetic program cost |
$2,150,302 |
$ |
|
Cost-effectiveness summary figures |
||
|
$ for WELLBY |
$9.4852 |
$ |
|
WELLBYs per $1,000 |
105.4278 |
WBp1k |
|
Times the cost-effectiveness of GiveDirectly |
13.96 |
xGD |
8. Funding Gap
The only funding this project has received so far is $500k from Open Philanthropy to conduct an RCT which includes a limited cosmetics intervention. They still need to secure the funding for the advocacy and follow-up work for Ghana. If they hit their larger fundraising goal of $1.8 million, they would also like to extend this work to Nigeria. The timeliness of this project is key to make use of the current momentum in Ghana for lead regulations. Acting in the future will mean a lower counterfactual number of years until the policy would have been implemented anyway, and may require more advocacy work to earn back the ear of the government.
9. Confidence
9.1 Depth
The depth of our analysis is based on a combination of how extensively we
have reviewed the literature and how comprehensive our analysis is. We use three depth ratings
in our work
.
We think this is a ‘low (or shallow)’ depth report. Namely, we have only reviewed
some of the relevant available evidence on the topic, and we have completed only some (10-60%)
of the analyses we think are useful.
9.2 Robustness
To try and account for the shallowness of this report, we have attempted to cleave a very conservative line throughout this report. For example:
- We do not consider the effects of reducing lead exposure on adults, only children.
- We do not consider life saving effects (see Plant et al., 2022, for discussion of how to model life saving effects).
- We have assumed the past non-cosmetic related previous advocacy work done in Ghana contributes just as much to the reduction of BLLs from cosmetics, as the future cosmetic-specific advocacy and enforcement. This means our guess of a 4 year counterfactual is likely a lower bound.
- We assume a short counterfactual of 4 years.
- Naively taking the average rate of success from the two previous Pure Earth spice projects would suggest a 93% reduction not a 38% reduction in lead exposure from the targeted source will be achieved.
- We have some preliminary results from what we think constitutes the first causal analysis of early childhood lead on adult mental health. We are not able to share these results, but they indicate childhood lead exposure has a much larger effect than the correlational studies on adult mental health and wellbeing.
- We do not account for improvements in life expectancy over time.
- We do not include community-level spillovers and use the minimum individual spillover rate of 16% to only account for emotional contagion in the household.
- We only apply spillovers to two household members which ignores future children, and the wider community potentially impacted
- We apply three validity adjustments which together represent a 0.19 adjustment (i.e., 81% discount).
If we relaxed our conservatism a little and assumed instead that (i) the counterfactual is 8 years rather than 4, (ii) Pure Earth will be just as successful at eliminating lead as they have been historically (38% → 93%), (iii) average BLLs are actually 8 μg/dL, and (iv) the spillover ratio is 40% then the cost-effectiveness increases up to 927 WBp1k. While optimistic, we do not think this value is unrealistic. We consider this to represent a reasonable upper bound to our estimate (although we acknowledge it could go even higher. We hope this demonstrates both why we are excited about this opportunity, but also how high our uncertainty is.
Some of this uncertainty is inevitable, but there are parts which we expect could be improved with more research and more time. For example, we hope that after this cosmetics intervention, we will have a better idea of how much targeting cosmetics actually lowers BLLs. Other questions we have include: Was the ingestion uptake coefficient suggested by the experts a good guess? Did cosmetics contribute more or less than we predicted to total BLLs? Did any unforeseen problems arise which made this less successful than the campaigns for spices were?
We also hope there is more work in the future on estimating how much advocacy campaigns improve counterfactuals. The application of such work will extend outside lead work, and allow charity evaluators to more accurately assess the impact of all advocacy campaigns, which seems like a valuable step forward for the sector as a whole. Currently our estimate is a subjective adjustment on a pure guess. There are reasons to think we might be underestimating, however truly we are just unsure.
Having shown the optimistic upper bound which we think this intervention could reach, we next turn to what we see as the greatest weakness of this report - the evidence quality.
9.3 Quality of evidence
Overall, we assess the quality of evidence is ‘low’, making our evaluation speculative.
The largest source of uncertainty in this report is the effect of lead exposure on children on adult mental health and wellbeing. Currently we rely on three correlational studies, of which two (both looking at the Port Pirie data) find non-significant results. The huge attrition rates in the Port Pirie studies means we think their results are low quality, and so their insignificant results concern us less.
To account for some of our data concerns we have applied three adjustments (0.75 for non-causal data, 0.51 for replicability, and 0.50 for generalisability) to attempt to remain conservative. However, no amount of discounts will ever be sufficient if lead has no causal effect on adult mental health. This is why we strongly encourage future research on lead to not only place an emphasis on ‘where is there lots of lead?’, but also ‘how much harm is it doing?’ and employ causal identification strategies, rather than rely on simple associations.
We think there are lots of reasons to be optimistic that future research will find positive effects. For example, we found three studies exploiting quasi-random natural experiments to identify the effect of childhood lead exposure on adult outcomes (Nilson, 2009; Grönqvist et al., 2017; Keyes et al., 2023). Though none report the impact on mental health or subjective well-being they do all report a negative impact of lead on their studied outcome. Moreover, as previously mentioned, we have seen some preliminary results from what we think would constitute the first causal study linking childhood lead exposure to adult mental health and subjective wellbeing.
We think funding studies to confirm a causal relationship should be of the highest priority. Our call for caution comes as this situation reminds us of a few years ago when the philanthropy community was in a similar situation with deworming. We explain the relevance here.
Some initial results suggested mass deworming might be a very low-cost intervention with massive upsides in the long-term (Kenyan Life Panel Survey; Miguel and Kremer, 2004; Hamory et al., 2021). However, there has been a lot of debate about the short-term null results in the deworming literature (colloquially termed the ‘worm wars’; Taylor-Robinson et al., 2019; Welch et al., 2019; but see Croke et al., 2024). In our own contribution to the literature (Dupret et al., 2022) we reanalysed the Kenyan Life Panel Survey - and found no significant long-term effect of deworming on subjective wellbeing.
Nevertheless, despite most of the modelling focusing on only that Kenyan Life Panel Survey and small uncertain results within it, philanthropists have continued to fund deworming because the cost to treat a person for deworming is very cheap. In general, though, we think it would be fair to say deworming is no longer considered as one of the best options available to do good in the eyes of most evaluators, academics and donors. For example, in August 2022, GiveWell (a prominent charity evaluator that recommends charities based on their mortality and economic impacts) dropped the four deworming charities from their top charities which had been there since 2010They stated this was because “deworming doesn’t fulfill the second criterion on our list—a high likelihood of substantial impact. However, we expect to continue supporting deworming through grants from our All Grants Fund, as there continue to be funding opportunities in deworming that exceed our cost-effectiveness threshold, and we encourage donors who have supported individual deworming programs in the past to keep doing so”. This was after GiveWell had directed over $163 million to these charities.
The point of this is not to throw shame on past funding missteps (as we well know at HLI, mistakes can easily be made in these complex decisions), but it would be wrong of us to not try and learn from them when these mistakes are inevitably made. So in hindsight it seems like more causal studies of short and long term effects of mass deworming would have been a valuable use of philanthropic funds. We would suggest that this is a lesson we should apply to lead exposure charities too.
We should clarify that our impression is that the lead literature is more robust than the deworming literature. As discussed above there are at least a handful of causal studies looking at non-wellbeing related outcomes (Nilson, 2009; Grönqvist et al., 2017; Keyes et al., 2023) and also a preliminary unpublished causal study with a wellbeing outcome.
Nonetheless we would be extremely interested in more studies exploiting natural experiments in this area, rather than more observational studies with correlational results which seems to be the trend in this literature. We think there are ample opportunities for this and would recommend funding researchers who want to pick up this topic. Please see Appendix E for some of our ideas about how this could be done.
9.4 Outstanding uncertainties
As we have attempted to emphasise throughout this report whilst the cost-effectiveness of our estimate is high, we have great uncertainty about some of the parameters which have gone into it. In this section we try to summarise our thoughts on these uncertainties and how we might address these in the future with better data or more time.
Causality
The lack of causal data is a major outstanding uncertainty, as mentioned in Sections 9.3 and 6.4.1.
Trajectory of the harm over the course of a lifetime
With more time we would like to do some more work modelling some different potential trajectories of wellbeing harm over-time. Our current assumption is that the wellbeing effect we identify at age 27 will persist until death (see Section 5.2 for more details). This seems like the most likely and reasonable option because the mechanisms through which we think childhood lead exposure affects wellbeing at that age (e.g., cognitive issues, health issues, socioeconomic status etc.; see Figure 2 for all the potential mechanisms we have identified) are all things that will persist with the person until death. Nonetheless, we could be wrong, and if there is significant decay from that point then we may have overestimated the effect.
Even better than us testing potential models would be data from which we can extract the actual wellbeing effects at different ages. But given we don’t have one causal study yet for any age group, we think this is not likely to happen soon.
Age of exposure
We would also be interested in studies detailing how age of exposure matters. How much worse is it to be exposed from 0 to 5 years of age, compared to 10 to 15? The literature also tends to be focussed on children because the absorption rate of lead is higher for children than adults and they tend to have more hand to mouth contact (Ziegler et al., 1978; Abelsohn and Sanborn, 2010). However, we expect there is still at least some effect on adults, and given the adult population is much larger than the child population we would be very interested in a study looking at the impact of lead exposure on adults on adult subjective wellbeing and/or mental health.
Percentage of lead burden attributable to cosmetics
We currently use Pure Earth’s estimate of the percentage of the total lead burden attributable to cosmetics, calculated in their internal tool the ‘Lead Impact Model’ (LIM). We detail the process by which they do this in Appendix B. Even Pure Earth has expressed to us how unsure they are of this estimate. Internally, they refer to the LIM as an ‘exercise’, not a tool, because they feel it was more helpful in identifying the things they don’t know, than giving them any concrete answers. Moreover, the estimates are based on tiny sample sizes in both the RMS and HBA.
Unfortunately, it is still the best and only estimate we have for this parameter. In the future Pure Earth intends to partner with Rethink Priorities data team to refine the LIM, who proposed breaking the uptake coefficient into three discrete steps: 1) the bioavailability of lead from a source (from the EPA’s IEUBK model); 2) the ingestion rate of material; and 3) the exposure frequency of a source. We much prefer this approach as we think consideration of exposure frequency to a source is notably missing from the current estimate. However, Pure Earth does not have the data to do this yet. There may be a funding opportunity here for donors interested in expanding the evidence base.
Spillovers
Due to time constraints we did not generate a lead-specific household spillover rate (see Section 6.5 for more details). Instead we impute our spillover rate from our psychotherapy analysis of 16% (McGuire et al., 2024b).
In the future we would like to try and create a lead-specific spillover rate, to capture any additional spillovers from reducing lead exposure like: Peer spillover effects, such as the educational spillovers suggested in Gazze et al. (2021); and community spillover effects, such as reductions in crime (Higney et al., 2021; Baranyi et al., 2021) or better health outcomes (Moskabady et al., 2018)
Counterfactual
To create our counterfactual we rely on LEEP’s CEA of preventing lead in paint in Malawi in which they guess the counterfactual is 8 years (see Section 6.2 for more details). This is just a guess though and we would like to try a more evidence based approach in the future.
While writing this paper we looked at some historical data on how quickly regulations were adopted for leaded gasoline and lead in spices (see Appendix D for more details). We think we could use data like this to compare how soon after the first country adopted regulation on a toxic product other countries followed. This would give us an idea of how long after a product was known to be toxic other countries acted. We think an important factor might also be the amount of poisoning the product is responsible for, with products which are responsible for the most damage being regulated the fastest. We do not expect this would be an easy task to combine this data, and our result would still be deeply uncertain. That is why we did not commit too much time to improving upon LEEP’s guess in this report.
In the future though we would like to try this, as it seems like an important metric for all advocacy based assessments.
10. Conclusions and researcher views
In this shallow evaluation of Pure Earth's campaign to remove lead from cosmetics in Ghana, we have demonstrated both the significant potential and considerable uncertainty surrounding the intervention’s impact. While the predicted cost-effectiveness of reducing blood lead levels (BLLs) through Pure Earth's efforts is highly promising, estimated at 105 WBp1k, this analysis is largely speculative, relying on limited evidence and assumptions. Nonetheless, the intervention offers an exciting opportunity to improve the wellbeing of Ghanaian children by reducing exposure to a dangerous neurotoxin.
Our analysis reflects a conservative approach, with steep discounts applied for uncertainties related to replicability, generalizability, and the true extent of BLL reductions achievable by this campaign. Pure Earth’s track record of success in Georgia lends credibility to their capacity for achieving meaningful reductions in lead exposure through advocacy and regulation. However, the fact we have not seen an intervention targeting cosmetics before presents us with some uncertainty.
As we consider the broader philanthropic implications, it is critical to emphasise the need for more research into both the harms of lead exposure and the effectiveness of advocacy interventions in accelerating regulatory action. This project may indeed represent one of the most cost-effective opportunities available to donors today, but it also carries the risk of overestimating the impact based on incomplete data – much like the historical case of deworming campaigns.
In conclusion, while this evaluation provides reason for optimism about Pure Earth's cosmetics intervention in Ghana, the need for further evidence cannot be overstated. Additional research, particularly focused on causal relationships between lead exposure and wellbeing, will be essential in refining our understanding of this high-potential opportunity.
Appendices
Appendix A: HBA estimate of lead burden of cosmetics in Ghana
Based on the data from the RMS and HBA, Pure Earth estimates that 9.4% and 43.5% (respectively) of all BLLs in Ghana stem from cosmetics. The latter figure is based on only 8 chilo samples (of which 100% were above the reference level). In comparison the RMS results are based on 28 samples of cosmetics.
The larger sample size implies we should prefer the RMS results, however at first glance the HBA results could seem more relevant. The HBA analysed aspects of the home environment and thus reflects products actively present in a child's home. In comparison the RMS only reflects what is for sale in the country. This is important because if there are leaded and non-leaded products on the market, but the leaded products are preferred because of cheaper prices, or superior quality, then a market sample will not accurately reflect how much exposure is coming from that product. We think this is likely to be an issue in cosmetics in particular because the safe version of chilo (kohl) uses antimony, which is more expensive and scarcer than lead (Navarro-Tapia et al., 2018).
However, we opt to use the more conservative RMS figures in our evaluation, because the HBA sample is not random - the households selected for the HBA, were selected because their child had high BLLs (Home Based Assessment Protocol, 2023). Thus we think that the HBA-based estimate that 43.5% of total lead exposure is cosmetics-related could be an overestimate. Moreover the results are based on only 8 chilo samples obtained from 293 households. We cannot tell if this means that only 8/293 = 2.7% of homes had chilo samples in them or if Pure Earth had a limit on the different items they could collect and so only collected 8 chilo samples but most houses had chilo in them.
Appendix B: Details about Pure Earth’s estimate
In a country, for each source of exposure of interest Pure Earth estimates the % of total lead exposure they think is from that source. They do this by using data from the RMS and HBA of what percentage of samples tested are above the relevant reference level for that product. They then multiply this by an ‘ingestion uptake coefficient’ which estimates what percentage of lead is actually absorbed by a person’s body given that source’s presence in the houseIn an internal document shared with us Pure Earth explains that “Ingestion Uptake Coefficient was introduced to estimate what percentage of lead is actually absorbed by a person’s body given that source’s presence in the house. For example, for foodstuffs like fish and spices, the coefficient is 100 percent, indicating that lead is definitely going to be ingested. For toys, the coefficient is 15 percent, as the toy has to be chewed and swallowed in order for lead to be ingested. The uptake coefficients were determined through a review of existing literature and expert opinion.” . These are generic figures calculated for each exposure source as opposed to something estimated for each country or each item. They repeat this for each source (adding an assumption that 30% of all lead exposure is from unknown household sourcesAs discussed in the previous section we add a further 30% discount on top of this to account for unknown non-household sources.) and then normalised so that the proportions from all sources sum to 1The formula can be represented as where (xk*u)/y x is the percentage of consumer goods identified above the reference value within a country, k is the source type, u is the ingestion uptake coefficient and y is the sum of the product of the x and u for every source. . We explain these elements and potential limitations below.
In Ghana 7% of cosmetics tested in the RMS were above the reference level of 2 ppm (parts per million)This threshold comes from the German Office of Consumer Protection and Food Safety (BFV), see Table 1 of Sargsyan et al. (2024).
. The ingestion coefficient for cosmetics is 30% (see Section 4 for how lead from cosmetics enter the body), meaning the estimated uptake from cosmetics is 7 * 30% = 2.1. The sum across all other products was 15.6, thus accounting for the 30% of exposure from unknown sources, the percentage of exposure for cosmetics is (2.1*0.7)/15.6 = 9.4%.There are some clear drawbacks to this approach including:
- We don’t know how far above the reference level samples are
- If the samples above the reference level in cosmetics are only just above the reference level, but the spice samples are much higher than the reference level, then lowering the number of spices above the reference level will have more of an impact on exposure than lowering the number of cosmetics.
- The ingestion uptake coefficients are just guesses
- We take some reassurance in the fact these are guesses by experts and academics in the field, and not Pure Earth’s own random guesses.
- Overall we are not too worried about bias in these guesses as all they would do is shift where the lead burden is coming from, rather than the total lead burden. Given Pure Earth wants to ensure the removal of all lead sources we do not see any incentive for foul play.
- Moreover, we have not seen a better source for this information, and we expect our guesses will be worse than experts in this area.
- We do not know what percentage of exposure comes from outside the household
- These results only consider household sources of exposure, and the 30% discount for unknown sources, is only for unknown household sources.
- We adjusted for this with a guess in Section 6.1.2.
Appendix C: Alternative estimates of BLLs
Sadeq et al. (2021) published a meta-analysis of studies comparing BLLs of children (aged 7 years and younger) with and without exposure to Kohl. With 7 studies (1565 children, 350 users versus 1215 nonusers), they estimate that exposure to Kohl is associated with an increase in BLLs of 5.81 μg/dL. This is much higher than the 0.40 μg/dL we calculated above.
We do not use this estimate because it seems like publication bias (small studies effects) is at play, these are not more causal studies than the other methods, this does not disentangle whether use of Kohl could lead to higher BLLs through pathways other than cosmetics (e.g., maybe Kohl users are also more likely to use leaded cookware), and the studies are from many places but not Ghana.
Another approach would be to take an estimate of how much lead ppm there is in leaded cosmetics like chilo, apply the 30% ingestion coefficient, and then apply a general absorption of lead to blood in the body (i.e., how much lead ingested then becomes part of the blood lead levels rather than being removed through waste and other processes by the body). This is inspired by the general modelling of the EPA’s IEUBK; namely, the EPA’s in-depth model of lead exposure to blood lead levels which breaks down sources and pathways in detail. We would need more precise data and modelling to do this. To give a quick example: if we assume cosmetics are barely at the 2 ppm reference level (they could be much higher), use the 30% ingestion coefficient from Pure Earth, and use an absorption coefficient of 0.66 (a total guess for illustration), then we would get the same estimate as our current estimate based on Pure Earth’s modelling: 2 * 0.30 * 0.66 = 0.40.
Appendix D: What other ways might we try and estimate the counterfactual in the future?
As we noted in Section 6.2, the counterfactual 8 years is a guess from a LEEP cost-effectiveness analysis that has been used by other evaluators since. We present below a range of factors that suggest that this might be an underestimate and that there are grounds for producing a more informed estimate in the future.
Core factors that suggest that this could be an underestimate is that governments can be slow to regulate, even when they have laws they might be poor at enforcement, and laws are not inevitable.
Governments and laws
When we know that a substance has substantial adverse effects, it does not mean that all governments are swift to regulate (Joint Research Council, 2019). See examples with leaded gasoline and leaded paint below.
Laws passing are not inevitable. Freitas-Groff (2023), using data from hundreds of close votes in the USA, estimates that barely passing a law leads to a huge persistence. Most laws that barely fail never become law. When discussing his paper on the EA forum, Freitas-Groff said “the average number of extra years a policy is in place by virtue of passing is probably at least 100 years”. Note that we think that this is probably too strong, more of an upper bound.
Nevertheless, BLLs seem to be declining slowly over time (Hwang et al., 2019). Hence, it seems like the global direction is right, and that the right framing for an intervention like Pure Earth’s is that is “pulling the timeline forward”.
Leaded Gasoline
There are a few counterfactual durations we could extract from the history of phasing out lead in gasoline (Kovarik, 2005; EPA; UN; Ritchie, 2022). In the US, sale of leaded gasoline started in 1923, the EPA called for a ban in 1973, and the final phase out and ban by the Clean Air Act came in 1996. Taking the initial EPA call of 1973 as the starting point, it took the US 23 years to ban leaded gasoline (73 years if we count from 1923). The first country to ban leaded gasoline was Japan (1986; 13 years) and the latest country was Algeria (2021; 48 years). Most of Sub Saharan Africa banned lead in 2006 (33 years). It seems plausible that because petrol was the first targeted product, regulation was slower to arrive as it took a while to convince countries that lead was a problem. Now it is accepted that lead is toxic we might expect more motivation and haste to ban and enforce bans on leaded products (although it still took Algeria 25 years since the US phase out in 1996!).
Ghana banned lead in paint in 2004, which is 31 years after the EPA’s call to ban and 8 years after the US ban. This could make for a much larger prior counterfactual years estimate.
Leaded paint
Issues with lead in paint have also been known for a long time and governments have been slow to ban it. The ILO had already made a proposal in the 1920s about regulating white lead in paint (which the UK did not ratify; Heitmann, 2004). The EU’s lead paint ban came in 1989 (ratified in the UK in 1992), but there are still recent issues, where in 2019, the EU ruled that the authorisation for a company to sell leaded paint for road markings was deemed illegal.
Laws are not sufficient, law enforcement is needed as well. For example, when we take the data on OWID about lead paint regulations and share of paint samples with high lead content, the difference is small between countries that do and do not have regulations (58% → 46% of paint with lead, n = 56 countries).
Lead in spices (Bangladesh)
Work by Forsyth et al. (2019) showed that despite Bangladesh setting the lead limit in turmeric to 2.5 ug/g in 2001, enforcement of the policy had been weak due to low state capacity. As a result in 2019 (18 years after regulation had been bought in), 8 of the 28 turmeric (29%) were above the regulation standard, with lead concentrations as high as 1151 ug/g (460x the legal limit). This further supports our intuition that even if Ghana is on the path to regulating lead in cosmetics soon because of Pure Earth’s previous advocacy work, they are still likely to require significant assistance in enforcing this regulation.
Appendix E: How could more causal data be gathered in the future?
We think this area must be ripe with opportunity for DID studies where lead exposure from a source is higher in certain areas in a country, and thus a nationwide ban on that source of lead exposure would act as an external shock affecting areas with greater lead exposure more. One example of this could be Pure Earth’s work in Georgia. They found the spices in the Adjara region of Georgia had a particularly high lead content, but over the course of two years they nearly completely eliminated this as a source of lead poisoning nationwide. This intervention occurred too recently for us to be able to use it to identify long-term effects, but we suspect there are countless similar examples.
Another method might be to use a regression-kink RDD to identify changes in subjective wellbeing before and after policy changes. A regression-kink design has the benefit of meaning lead does not have to be immediately eliminated, which is unlikely given the tendency of lead to linger (for example, after leaded-gasoline is banned lead still remains in the air for some time).