

Summary
Globally, 45 million children suffer from malnutrition, leading to 2.3 million child deaths annually. But even for those who live, the experience of malnutrition can have lifelong impacts on physical and cognitive health and social-emotional development.
There is a consensus on how best to address extreme malnutrition: feeding kids a standard formula of peanut butter enhanced with vitamins and nutrients alongside basic medical care to prevent or treat infections. This intervention, known as community management of acute malnutrition (CMAM), saves lives and improves health and development.
In this shallow reportThe lead author spent around ~90 hours on this report. , we evaluate the cost-effectiveness of a CMAM programme in Nigeria delivered by the organisation Taimaka. To our knowledge, this is the first analysis of the impact of CMAM on long-term wellbeing. We also think this is the first wellbeing cost-effectiveness analysis of a nutrition charity (along with our analysis of Fortify Health).
This forms part of our broader work to assess the cost-effectiveness of interventions and charities based on their impact on subjective wellbeing, measured in terms of wellbeing-adjusted life years (WELLBYs). One WELLBY is equivalent to a 1-point increase on a 0-10 wellbeing scale for one person over one year. We focus on subjective wellbeing because we believe it best captures what ultimately matters, wellbeing. By using wellbeing as a common outcome, it allows us to make apples-to-apples comparisons between very different interventions.
There are no RCTs estimating the wellbeing effects of CMAM programmes, so we extrapolate the effect on long-term wellbeing using broader evidence about the effects of malnutrition and treating it. Specifically, we use three sources of evidence, to which we give equal weight in our analysis (i.e. 33% to each):
- One RCT on the impact of atole, a corn-based protein supplement (n = 1,249).
- A Meta-analysis of 13 RCTs on the impact of another nutritional supplement, small quantity lipid-based nutrient supplements (n = 23,588).
- Two natural experiments on the effects of scarring from famine (n = 34,724).
Based on this evidence, we estimate that CMAM programmes have a wellbeing effect of approximately between 0.09 to 0.46 standard deviations (SDs) per person that lasts 62 years. The naive total individual benefit is 3 to 15 WELLBYs with an assumed spillover effect of 16% WELLBYs for a total effect of 17 to 57 WELLBYs. However, we discount this by 91% to 51% (for a mix of replicability and generalizability concerns) to arrive at our final effect estimate of 5 to 6 WELLBYs.
Taimaka estimates they can treat a child with malnutrition in 2025 for ~$87. We estimate Taimaka’s life-improving cost-effectiveness (after discounts) as ranging from 60 to 72 WELLBYs per $1,000 (WBp1k) with a central estimate of 66 WBp1k. The cost is $15 per WELLBY, or in other terms 9 times as good as GiveDirectly cash transfersFor GiveDirectly we estimated the cost-effectiveness at 7.55 WBp1k (i.e., $132 per WELLBY; McGuire et al., 2022a). GiveDirectly is an NGO which provides cash transfers to very poor households. We take cash transfers as a useful benchmark because they are a straightforward, plausibly cost-effective intervention with a solid evidence base. (For more detailed and updated charity comparisons, see our charity evaluations page.). The exact figure depends on which indirect evidence sources we extrapolate from: causal evidence of famine or two nutritional interventions related to RUTF.
Although we have some uncertainties in our analysis, we view Taimaka as a charity with promising cost–effectiveness. It also exhibits positive qualitative factors such as transparency and evidence-based decision-making. We compare Taimaka to other charities and discuss our current funding recommendations on our websiteA recommendation depends on how the cost-effectiveness compares to other charities, some of which may not have been evaluated at the time of this report. . At the time of writing this, we believe Taimaka could absorb $500k in additional funding for 2025.
We also estimate that those who would place a high value on saving lives (having deprivationist beliefsFor an explanation of deprivationist views, and the alternatives, see Plant et al. (2022).) would attribute an additional 66 WBp1k to Taimaka.
We rate the depth of work supporting this estimate as lowBy this we mean that we believe we have only reviewed someof the relevant available evidence on the topic, and we have completed only some (10-60%) of the analyses we think are useful. There seems to be much more evidence and analysis that could be applied (c.f. Appendix d), although we are not sure what it would be. and the evidence quality is also as low (i.e., weak). For these reasons we view this analysis as speculative. The evidence quality is weak primarily because CMAM lacks direct causal evidence for its effects on any outcome. There are ethical issues with running a randomised controlled trial (RCT) where a control group of malnourished children isn’t fed.
We think the best way to improve the evidence base for the wellbeing effects of treating malnutrition is to add wellbeing outcomes to the follow-ups of RCTs of related treatments for milder forms of malnutrition. We discuss this and some further topics for research in Appendix E, at the end of this document.
Acknowledgements: We would like to recognise in these footnotes the contributions of authorsJoel McGuire contributed to the conceptualization, investigation, analysis, data curation, and writing of the project. Ben Stewart, contributed to the analysis, and writing of the project. Samuel Dupret contributed to the analysis and data curation of this project. Ryan Dwyer and Michael Plant contributed to the supervision, and writing of the project. , reviewersWe thank the following reviewers: Juan Benzofor reviewing the general document; Madeleine Duarte, Lizzie Shell, Scott Wrigley, and Nick Laing for feedback about nutrition. , and staff from the charities we have evaluatedWe thank Justin Graham and Olivia Shoemaker for their feedback about Taimaka. .
0. Outline
In Section 1 we provide an overview of the types of malnutrition, the extent of the problem, and mention some mechanisms for how malnutrition can harm wellbeing.
In Section 2 we introduce community management for acute malnutrition (CMAM).
In Section 3 we estimate CMAM’s life-improving and life-saving effectiveness based on an eclectic mix of evidence.
In Section 4 we introduce Taimaka, which delivers CMAM in Northern Nigeria.
In Section 5 we estimate the cost-effectiveness of Taimaka.
In Section 6 we explain our assessment of the quality of evidence supporting our estimate.
In Section 7 we conclude by giving our view of the cost-effectiveness of CMAM and funding to Taimaka. We also discuss some opportunities for further research and their value.
1. The problem: malnutrition
In this section we provide some context for this report, a general introduction to the problem nutrition interventions are trying to solve: malnutrition. We discuss possible interventions to address malnutrition and general mechanisms for nutrition to affect wellbeing.
1.1 Context: Exploring nutrition
This report was part of a project that explores the evidence and cost- effectiveness of nutritional interventions on subjective wellbeing (SWB) in LMICs.
We consider this a first look at a broad and complex topic, and as a result the implications are provisional. This introduction is mostly shared (i.e., duplicated) between the nutrition reports (i.e., the iron fortification report).
Despite the vast literature about nutrition, we did not find much evidence relating nutritional interventions to subjective wellbeing. We discuss our general search strategy in Appendix A.
We used the evidence we found in this general exploration of nutrition to perform two very speculative cost-effectiveness analyses. The first is community management of acute malnutrition (CMAM, evaluated here), and the second is iron fortification of wheat. We discuss other interventions we didn’t investigate in Appendix B.
1.2 Types of malnutrition and ways to address them
Nutrition, the intake of food with the elements necessary for health and bodily function, plays an important role in development (NIH). However, the types of possible nutrition interventions are vast, reflecting the complexity of malnutrition. Malnutrition, defined by WHO, “refers to deficiencies, excesses, or imbalances in a person’s intake of energy and/or nutrients.” Malnutrition can be chronic or acute.
Malnutrition can be further divided into two types:
- Undernutrition: a lack of sufficient caloric or macronutrient intake. The Food and Agriculture Organization (FAO) uses this synonymously with hunger. Undernutrition is often addressed by providing more and better food. This takes different forms, depending on whether the undernutrition is acute or chronic.
- Micronutrient-related malnutrition: “Inadequacies in intake of vitamins and minerals” such as vitamin-A, iodine, or iron (WHO, 2024). Micronutrient related malnutrition is treated with nutritional supplements either in the form of multivitamins, specific supplements (e.g. vitamin-A), fortifying food (e.g. adding iodine to salt), or breeding crops to contain more essential nutrients.
1.3 Is malnutrition still a problem?
Malnutrition is measured in different ways. As we will show, however it’s measured, malnutrition is still a large, and in some regions, resurgent problem.
Undernutrition
Acute undernutrition (often called ‘acute malnutrition’) is often measured by ‘wasting’, which is a low weight for a given height (WHO, 2024). The share of children experiencing wasting is relatively small and declining (9% → 7% for the world from 2000 → 2022; OWID). However, given that wasting often indicates a very serious medical condition, the ~7% still represents a large amount of suffering.
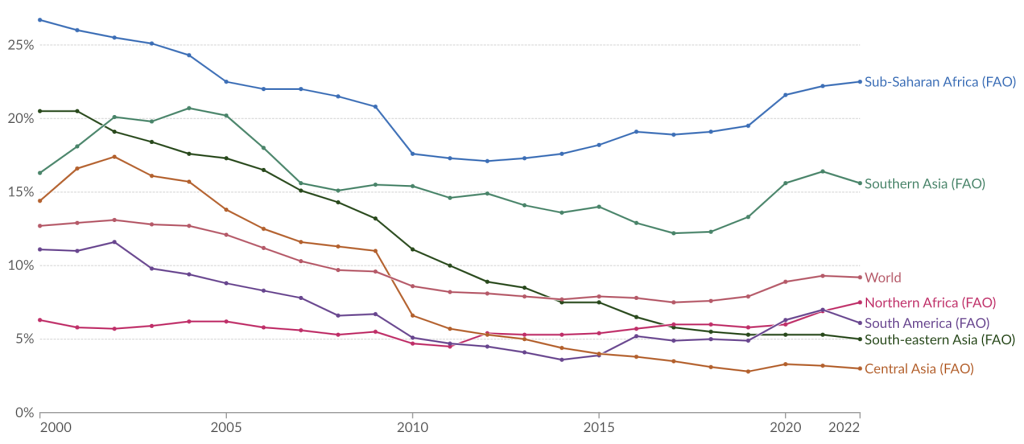
Chronic undernutrition is often measured as the shortfall of average available calories, compared to the estimated requirement for a country. As we show below, in Figure 1, progress in many regions of the world has stalled or reversed.
Figure 1: Share of individuals who are undernourished by region (OWID, 2024)
Another measure of chronic undernutrition is ‘stunting’, which is defined as the share of children under the age of 5 who fall more than two standard deviations below their expected height (WHO, 2024; 2015). Children can technically be stunted due to either undernutrition or micronutrient deficiencies, but it’s commonly viewed as a measure of chronic malnutrition.
The share of stunted children remains quite high (above 30%) in many regions of the world (c.f. Figure 2).
Figure 2: Share of individuals stunted by country (OWID, 2024)
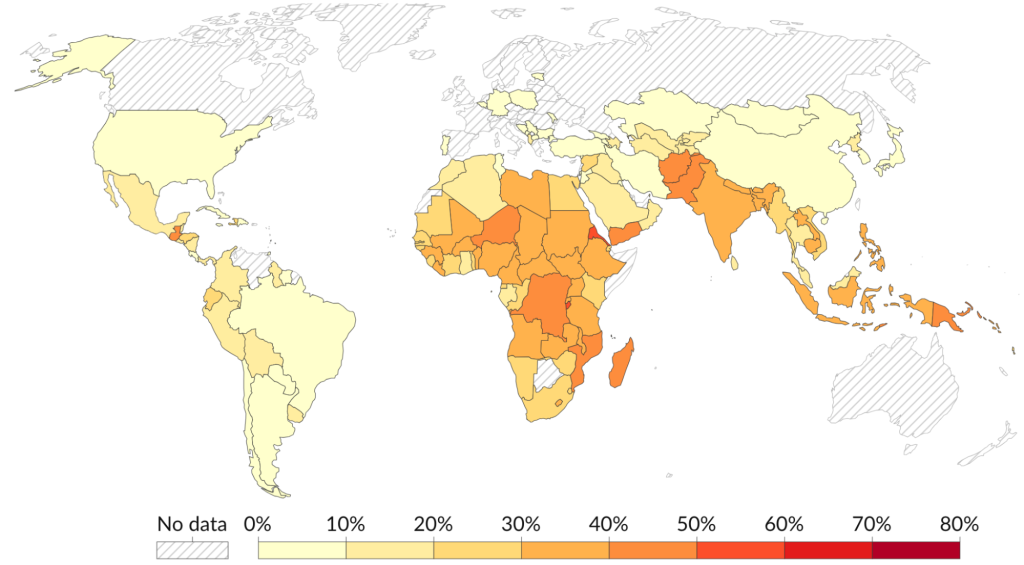
Note: We show 2015 results because data is much sparser in more recent years.
Micronutrient deficiency
The degree of micronutrient deficiency depends on the nutrient, but for example the share of children with anaemia (low red blood cell count, often caused by lack of iron) remains high at 40%, globally, in 2019 (OWID, 2024). Data is more outdated for other nutrients, but the latest available data (2005), presented on OWID showed high levels of deficiency for zinc, iodine and vitamin-A. For example, more than half of children in many African countries were deficient in Vitamin-A.
To help clarify these terms, we summarise the different measures we discussed below in table 1.
Table 1: measures and types of malnutrition
|
Measure |
Type of malnutrition it captures |
How it's measured |
|
Wasting |
Acute undernutrition |
Weight for height |
|
Chronic undernutrition |
Chronic undernutrition |
Average calories |
|
Stunting |
Chronic |
Height for age |
|
Micronutrient deficiency |
Micro related |
Blood marker |
While we mention all of these measures to give background, in the rest of this report we will focus on acute undernutrition (which will be called acute malnutrition, measured by wasting).
1.4 Mechanisms for improving wellbeing through nutrition
We expect there are several possible channels for childhood nutrition to affect wellbeing later in life. A non-exhaustive list of examples are:
- Physical and cognitive health: Nutrient supplementation interventions aimed at preventing acute malnutrition appear to benefit an array of physical and cognitive outcomes of children (Dewey et al., 2021, n =~ 37,000; Prado et al. 2021, n = 30,024). Even just antenatal micronutrient supplementation (multi-vitamins) appears to bolster cognitive function of children (Chao et al., 2023, n= 12,986).
- Social emotional-development: Prado et al. (2021, n = 23,588) also finds a 0.08 standard deviation (SD)SD changes are the outcome for standardised effect sizes that use the outcome SD as the standardising element in the denominator (e.g. Hedges g or Cohen’s d). effect (95% 0.05, 0.11 SD) of addressing chronic undernutrition on social-emotional skills (relating to empathy and self-regulation) of children.
- Scarring: Generally, being harmed as a child may permanently affect someone’s wellbeing through psychological scarring.
- Other mechanisms: We think there are other intermediate outcomes, such as economic or social outcomes, which could be affected by these direct channels. This could lead to lower wellbeing but reviewing these was outside the scope of this report.
This is, admittedly, an incomplete list. With more time, we think it’d be worth expanding on this. Note that in the small quantity lipid-based nutrient supplements section (3.3) we explore the cognitive and social-emotional pathways in more depth.
2. Community management of acute malnutrition
Community management of acute malnutrition (CMAM) is meant to address moderate or severe acute malnutrition (MAM/SAM). Acute malnutrition (or undernutrition) is a protein-energy deficit, which is identified by low weight for the predicted height (i.e. wasting). It can be split into two further subcategories - kwashiorkor (protein deficiency) or marasmus (deficiency of all macronutrients). Acute malnutrition was often treated in hospitals, but care can be provided more cheaply – but just as effectively for mostThe WHO notes that children “who have medical complications, severe oedema (+++; generalizedto feet, legs, arms and face), or poor appetite (fail the appetite test) or present with one or more IMCI danger signs (unable to drink or breastfeed; vomits everything; has had convulsions (more than one or prolonged >15 min); lethargic or unconscious; convulsing now) should be treated as inpatients.” (2023). – in the community experiencing the problem (Collins et al., 2006); thus CMAM has increasingly become accepted (WHO, WFP and UNICEF, 2007; Park et al., 2012).
GiveWell has a good description of CMAM, which we draw on here to describe the process (2024). CMAM involves several characteristics that lead to a three-step treatment: “find, stabilise, and feed”.
The process for targeting those with acute and moderate malnutrition involves first:
“using community health worker networks or by training caregivers (usually mothers) to screen children using coloured plastic strips to measure mid-upper-arm circumference (MUAC), a marker of nutritional status.”
The next step is:
“Assessing children who meet the criteria for SAM or MAM and referring children who are too sick for CMAM to hospital inpatient care.”
There are two primary components of treatment. The first is quite general, and is related to the fact that malnourished children are more likely to die from disease and infections:
“Providing a standardised set of medical treatments for SAM children, including antibiotics [and often antimalarials] to reduce infections, speed up nutritional recovery, and prevent mortality.”
This general medical element isn’t something we directly consider the wellbeing effects of in this analysis. Although we think the life-saving benefits of more medical services will be captured in the mortality effects, we haven’t considered the life-improving effects that we expect occur due to avoiding scarringBeing exposed to disease at a young age can have lifelong negative effects (Barker, 1990; St Clair et al., 2005; Venkataramani, 2012) so we expect that the use of antibiotics might save children from diseases that would have otherwise hurt their long term development. However, we do not have evidence of the extent to which this impacts later in life wellbeing in this context so we ignore its effect for now. In the future we may revisit this. . We primarily focus on the next component, which is actually addressing the nutritional and caloric deficit by:
“Providing ready-to-use therapeutic food (RUTF), a nonperishable, calorie- and micronutrient-dense food designed for treating malnutrition, until children meet criteria for discharge[The criteria for discharge, according to Taimaka’s website, is when children have met the following criteria: 1) They reach the green band of the MUAC (mid-upper arm circumference) tape, signalling that they have regained a critical amount of body mass and have no other clinical complications, 2) no nutritional oedema (characterised by swollen body parts), a healthy weight for height and 3) no medical complications. ]. Combined protocols provide RUTFs to both MAM and SAM cases. They generally provide children with SAM a lower dosage of RUTF than standard protocols in order to expand coverage while still providing enough nutrition for children to recover.”
This element, the supply of RUTF, is the focus of our attempt to estimate the wellbeing benefit of CMAM, so it’s worth going into a bit more depth of what RUTF is.
RUTF is an energy-rich, high-calorie and micronutrient-enriched peanut-based paste. Its standard composition is set by the WHO and it is commonly used to treat severe acute malnutrition (SAM). A single 92g packet contains approximately 500 calories, and all the necessary micro and macro nutrients for healthy child development.
We were unable to find any literature on the long-term effects of RUTF on wellbeing, happiness, anxiety, depression or general affective mental health after eight hours of searching. The literature appears sparse on the causal effects of RUTF on any outcomes compared to receiving nothing. This is because it is justifiably considered unethical to withhold food from acutely malnourished children to create control groups for RCTs. However, there are many studies looking at the short-term health benefits comparing one form of RUTF to another (Schoonees et al., 2019; Potani et al., 2021; Teshome et al., 2024), or in a longitudinal (but not causal) manner (e.g. Lenters et al., 2013).
2.1 Why CMAM?
The primary reason we evaluated CMAM as an intervention was that we came across (via word of mouth) an organisation delivering CMAM (Taimaka, discussed in Section 4) that seemed to potentially be a good funding opportunity if CMAM turned out to be cost-effective. The secondary reason is that CMAM seems to be the gold standard for treating acute malnutritionWe think it’s becoming the standard of care for several reasons. First, it’s believed to be just as effective as care in hospitals (Bahwere et al., 2012). Second, the advent of RUTF saves labour and storage costs, which, combined with better coverage through treatment in communities, dramatically increased the cost-effectiveness. Third, for the previous reasons it’s been endorsed by global organisations WHO, WFP and UNICEF, 2007).. Acute malnutrition is arguably the most severe form of malnutrition, and we expect the per-person effects of CMAM to be larger, (and thus more easily detectable), than other nutritional interventions.
3. The impact of treating acute malnutrition
We estimate the benefit of CMAM, using broader evidence (i.e., not relating to CMAM specifically) that explores the effects of malnutrition and treating it. Specifically, we make four different estimates based on three different interventions or eventsWe also considered using a fourth evidence source, a study that compared children who experienced acute malnutrition as a child in Barbados to healthy children (n = 129). We decided, however, that this evidence was too speculative, given its small sample and that the design doesn’t afford a causal estimation of the effect of reducing malnutrition. Nevertheless, we discuss it in Appendix B. :
- Using the very long-term wellbeing effects of an RCT (n = 1,249) of providing a protein and calorically rich supplement (called Atole) over three years, compared to receiving a less nutritious supplement.
- Using seven studies of two natural experiments (n = 34,724) studying the very long-term wellbeing effect of famines in the Netherlands and China. This involves a subjective judgement of how much of the effects of famine were due to acute malnutrition versus other factors, like chronic malnutrition, displacement or having family members die.
- Using an individual level meta-analysis of 13 RCTs (n = 23,588) of small quantity lipid-based nutrient supplements (SQ-LNS). These are analogous to smaller dose versions of RUTF, intended to treat chronic malnutrition and prevent malnutrition in children aged 0.5 to 2 years. Here, we attempt to translate the short term cognitive and socio-emotional benefits (measured at a few months to a few years after treatment), into wellbeing benefits later in life.
When combining these estimates, we assign equal weight to each estimate
from each intervention or event, reflecting our high degree of uncertainty as to which is the
most informative. For small quantity lipid-based nutrient supplements (SQ-LNS),
since we analyse the effects through two separate pathways, we choose the highest
estimate (in this case the intelligence quotient (IQ) pathway). We do so because we would
not expect the effect to ever be lower than the highest individual pathway. This
follows the methodology GiveWell
used in an analogous analysis.
We preview the results in Table 2 below. The ensuing sections are dedicated to explaining where these figures come from.
Table 2: Estimated effects of RUTF based on different sources of evidence
|
Source of estimate |
||||
|
Parameter |
Atole (Protein) |
Famine |
SQ-LNS (IQ path) |
SQ-LNS (social-emo skills) |
|
Total direct effect size (WELLBYs) |
56.84 |
11.37 |
17.29 |
5.31 |
|
Validity Adjustment |
0.26 |
0.75 |
0.43 |
0.43 |
|
Generalisability adjustment |
0.41 |
0.75 |
0.98 |
0.98 |
|
Total intervention level adjustments |
0.10 |
0.56 |
0.41 |
0.41 |
|
WELLBYs (after intervention adjustments) |
5.94 |
6.39 |
7.17 |
2.20 |
|
Weight on estimate |
33.33% |
33.33% |
33.33% |
0.00% |
|
Average WELLBYs |
6.50 |
|||
3.1 Outline of interventions and methodology
Interventions
A clear issue with using different nutritional interventions to estimate the effect of related, but distinct, nutritional interventions is that they have different compositions and are used for differing durations. As we show in Table 3 below, Atole and SQ-LNS tend to have fewer calories and less protein per serving, but are served over a longer time period than ready-to-use therapeutic food (RUTF). In terms of total calories provided over the course of a typical treatment, SQ-LNS and RUTF are similar. However, Atole, as provided in the RCT we discuss shortly, has a much higher caloric dosage overall. Unsurprisingly, we don’t have details on the negative calories that the typical experience of famine would entail.
Notably, we use these characteristics to extrapolate the effects from Atole and SQ-LNS to RUTF. Our current guess is that the importance of nutritional factors, in descending order, are 1) total calories, 2) total protein content and 3) total time provided. Time comes last because we think it’s mostly redundant, given the previous two factors. Similarly, we don’t count daily calories as a factor because it’s redundant and less individually informative than the other descriptions. We’re very unsure about how much to weigh the importance of calories, protein, and the overall time received and view this is an aspect of our analysis to improve in the future.
Using evidence from SQ-LNS (Prado et al., 2021), we also attempt to adjust for the fact that each calorie and gram of protein may have a higher effect (~4x) on acutely, rather than non-acutely, malnourished children for cognitive and socio-emotional outcomes.
We discussed this problem of extrapolation with several experts (two medical doctors, one nutritionist and one nutrition researcher). The consensus was that this was a sub-optimal evidential situation. Ideally we would use something like variation in the nutritional composition of an intervention (such as SQ-LNS) to model how much each component matters for our outcome of interest. However, SQ-LNS (like RUTF), the intervention with the most evidence, does not appear to vary much in its composition. This may be worth investigating more.
Our takeaway from those conversations was that nutrition science isn’t yet at a place where we can have a general sense of how different doses of nutrients will affect developmental outcomes. The reviewers generally endorsed that calories and protein both matter quite a lot, but there were some differences of opinions about whether calories or protein is more important.
Nick Laing, a doctor working in Uganda and the reviewer who engaged most with the problem of extrapolation, raised several points worth mentioning. He expects that using total calories alone isn’t the best proxy for dosage, for a couple reasons: First, in his view the calories and nutrients received in the first few weeks are disproportionately important to malnourished children. Second, the protein and other nutrients play an important role in supporting the immune system and preventing infections. Indeed, he thinks it’s possible that calories aren’t the biggest factor in improving the developmental outcomes of malnourished children.
Unfortunately, these conversations did not resolve our uncertainty much, other than suggesting there was not something obvious we were missing. Admittedly, this lack of insight might have been because the authors simply didn’t ask the right questions. With more time, we would try to come up with a more sophisticated model to account for the different characteristics of interventions and consult further with experts.
Table 3: Comparison of intervention characteristics
|
Per serving size |
92g |
20g |
180ml |
180ml |
|
Calories per serving |
492.20 |
117 |
163 |
59 |
|
Protein per serving |
14g |
3g |
12g |
0g |
|
Serving per day |
1.57 |
1 |
2 |
2 |
|
Duration of treatment |
1.62 months |
12 months |
36 months |
36 months |
|
Total servings |
84 |
365 |
2,189 |
2,189 |
|
Total calories received |
41,345 |
43,958 |
356,774 |
129,139 |
|
Total protein received |
1,159 |
1,094 |
25,171 |
0 |
|
Malnutrition targeted |
acute |
chronic |
chronic |
chronic |
Note: *Taimaka delivers an average of 84 doses over 7 weeks in a course of CMAM, hence why the servings per day is a decimal figure.
General methodology
Across the studies we used to estimate the effects of malnutrition (and treating it), we extracted effect sizes. When there were multiple outcomes, we combined these using meta-analytic methods. As an explanation, a meta-analysis is basically a weighted average of the underlying study, based on the precision of a study's estimated effect (i.e. more accurate studies get more weight). More technically, we use models that allow for us to leverage more complex data structures, such as having multiple time-points per study, without giving a study with more data points disproportionately more weightThere is dependency between the effect sizes because there are multiple effect sizes per study, multiple studies and effect sizes per event types. We adjust for this by using multi-level modelling, as recommended by the literature (Moeyaert et al., 2013, 2015; Assink et al., 2016; López-López et al. 2017; López-López et al. 2018; Cheung, 2014, 2019; Fernández-Castilla et al., 2020; Harrer et al., 2021). . For more discussion of how we use meta-analyses, see Section 2.2 of our psychotherapy report for the most up to date discussion (McGuire et al., 2024b).
We discuss the evidence for these events or interventions and how we use them to estimate the effect of CMAM (specifically the RUTF component) in the next sections.
Methods used across analyses of the effect of nutritional supplements
Across analyses, we assume the same pattern of long-term effects. We assume that the negative impact of malnutrition rises until the age of 25, after which it plateaus until death. This assumption of life-long effects is based on some general evidence related to the 50+ year mental health benefits of a protein-caloric rich supplementation for 3 years as a child, and the psychological harm of being exposed to famine in early years (we will discuss each in more depth in the next few sections).
This is also in line with the modelling we did for our shallow exploration of lead exposure, McGuire et al., (2023b). In contrast, our normal analyses typically assume that benefits or harms decay over time. However, in the case of our causal evidence on nutrition, we can observe the long term effects and have to guess at the short term effects: with lead exposure, we have data on the short term effects and have to guess at the long term effects. That is, two sources of our data (the Atole protein supplement and famine) measure the effects approximately 50 years after treatment which means assuming the effects are similar at younger ages is a potentially conservative choice. If we assumed that the harms declined over time then that would imply harms were much larger earlier in life, and total harms would be larger as well.
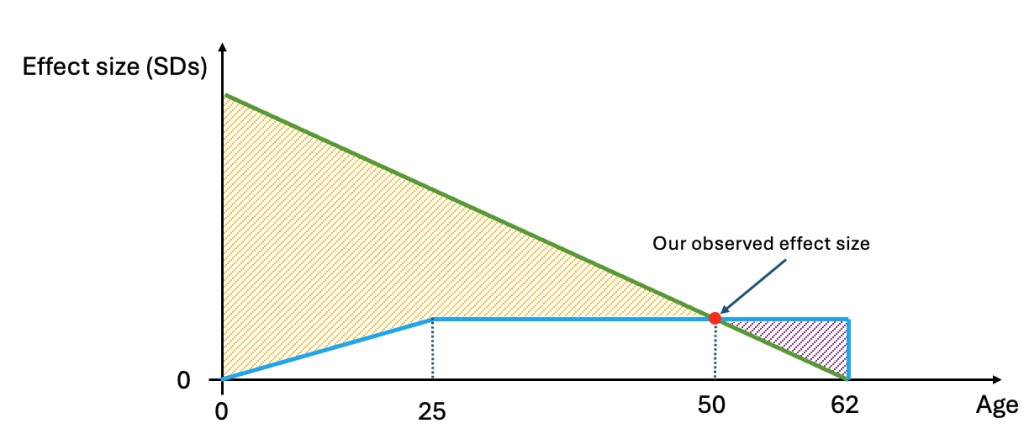
For a graphical explanation of why this is please see Figure 3 below, This shows what the modelling would look like if we assumed the effect size decayed from birth to our observation at ~50 years follow-up (area under the green line) vs our assumption that the effect grows until 25 and then plateaus (area under the blue line). The orange shaded section is the loss from our flat modelling vs decay modelling. The purple area is the gain. Given the orange area is much larger than the purple, you can see our modelling choice likely underestimates the effect.
We also account for household spillovers (the indirect effect that treating a person has on their household). We se the same 16% spillover we use in our psychotherapy report (McGuire et al., 2024b)The spillover effect may be an underestimate indicated by the high percentage of mothers with malnourished children suffering depression. We may update the spillover adjustment when Taimaka’s research concludes. . This means that if the treated person gets 1 ‘unit’ of benefit, each member of the household gets 0.16 units. Apply this to the predicted average household size in Gombe, Nigeria (where Taimaka operates), of 6.69 (Nigerian Living Standards Survey, 2018-2019) and there is an additional effect of over 1 unit in spillover effects, on average.
Figure 3: Difference in total effect due to modelling assumptions
We do this in an effort to make our analysis here more comparable to those for other interventions where we count spillovers (which we do in general). If we didn’t include it here, we would automatically be penalising the cost-effectiveness of this intervention. The choice of psychotherapy spillover as an analogy is seen as a research-cheap and conservative choice, since we believe that most of the spillover effects of psychotherapy arise from the simple pleasantness of being around a happier person (i.e. pure emotional spillovers). In other words, we think that the psychotherapy spillover approximates the household effects that all wellbeing improving interventions will, at least, provide. We are not confident 16% is the right choice here, but we do not have, or expect to find, data specifically on household spillovers for nutrition, so this is an educated guess.
Note, as per our general approach, we convert SD-years (e.g. a 0.2 SD effect lasting 10 years is 0.2 * 10 = 2 SD-years) to WELLBYs (e.g. points on a 0 to 10 wellbeing scale) based on a conversion factor of 2 – where the 2 represents the global average SD of life-satisfaction (see Dupret et al., 2024 for more details).
We also use an adjusted life expectancy for children in Nigeria of 62 yearsReported life expectancy is typically ‘period life expectancy; i.e., the lifespan of an infant born today if conditions remain unchanged. However, we expect medical conditions to improve over time and thus life expectancy to increase, especially in low income countries. We modelled a range of options internally to account for this, and have settled on using the predictedperiod life expectancy in year X according to the UN (OWID) where X = birth year of person + the period life expectancy in that year. For example, for someone born in 2020 in Nigeria their life expectancy is 53 years. Therefore, we use the UN projected life expectancy in 2020 + 53 = 2083 which is 63 years. So far this is the best performing option we have identified. when calculating the total effects over the lifespan.
3.2 Estimate 1: Atole (protein) derived estimate
The most relevant evidence we found to estimate the effect of RUTF is an RCT of a somewhat similar supplement.
The evidence we use, and the only evidence we found for the long-term effects of any nutritional intervention on long term mental wellbeing, comes from DiGirolamo et al., (2022). This study is the longest follow-up of any RCT we have found (40-60 years), and is part of the Institute of Nutrition of Central America and Panama (INCAP) longitudinal study. The INCAP study followed 2,392 participants in Guatemala who were originally part of a nutritional RCT.
Design of INCAP study
Originally, the INCAP study was based on matching two pairs of villages (for a total of four, out of a possible 300 villages), based on observable characteristics. After which all children (ages 0 to 7) in a village were randomly assigned to one of two beverages they could access twice a day. The drinks provided were Atole or Fresco. Atole is traditionally a corn flourTechnically it’s masa, which is like corn flour but with the hulls removed. based beverage from Mesoamerica, in the trial the masa was replaced with the more nutritious ‘incaparina’ blend of maize, cottonseed and soya bean flour (Tartanac, 2000). Fresco is a drink without protein, and with 36% of the calories“Protein deficiency was identified as the main cause of malnutrition at the time the study was planned so the focus was on improving protein malnutrition while assuring [sic] enough extra energy to allow for protein use; the supplement was designed to be additive to the children’s diet [...] The original study participants were assigned to Atole or Fresco by their village of birth. Atole was composed of 13.5 g of Incaparina (a nutritious gruel with high vegetable protein and moderate energy content highly accepted in Guatemala), 21.6 g of dry skim milk, and 9 g of sugar, totaling 163 kcal of energy and 11.5 g of protein per 180 mL/cup serving, compared with Fresco which was composed of 13.3 g of sugar, with 59 kcal of energy, and 0 g of protein. Both drinks were similarly fortified with micronutrients (e.g. iron, riboflavin, vitamin A) in equal quantities per unit volume.” DiGirolamo et al. 2022 (Ramirez-Luzuriaga et al. 2021).
Compliance differed across villages, especially for early ages with Atole children attending the centre 50-65% of the days available, compared to Fresco children only attending 10-30% of the time for the first year of life. Fresco children converged on the attendance levels of Atole children by age four (Schroeder et al., 1992). However, surprisingly, due to substitution in Atole families, the difference in average daily caloric and protein consumption between children in the different villages ended up approximately reflecting the intended differences (Martorell et al., 2020). The original designers of the trial intended Fresco to be a placebo, but given its different appearance and taste, the villagers treated the Atole as more nutritious and Fresco as more refreshing, which Martorell et al. (2020) frame as explaining the differences in consumption patterns. Relatedly, attendance was higher amongst lower socioeconomic status families in Atole but not Fresco villages (Schroeder et al., 1992), which is clearly a threat to internal validity if relying only on the between village estimates.
The design, comparing two treatments to two control villages, is underpowered for a cluster RCT. However, DiGirolamo et al. (2022) exploits another source of variation in exposure: age. They also compare individuals who were exposed to Atole in the first three years of life to those who were exposed as older children (and not in the first three years). This only somewhat mitigates our concern about the study being underpowered. However, as we note below, it is reassuring that the treatment effect is similar in size across control groups used. The longitudinal study of the RCT has other serious issues, such as high and potentially differential attrition.
Attrition
Of the original 2,329 participants, 1,249 (53%) responded to the follow-up study, which occurred around 50 years later DiGirolamo et al., 2022). While 53% is impressive given the duration of the follow-up, high attrition still poses a threat to the internal validity of the study. Ramirez-Luzuriaga et al. (2021) goes more into the details, noting that around 16% of the original sample (385 individuals) died, mostly in childhood due to infectious diseases. Another 11% (255) migrated abroad. A small share were untraceable (109) and the remainder either didn’t respond to contact (114) or refused to participate (261).
It’s unclear if any of these factors were differential between treatment and control groups. We haven’t seen a sophisticated treatment of attrition in any of the INCAP papers (i.e. imputation, Lee bounds, etc.). From DiGirolamo et al., (2022) it seems like overall the attrition rate was quite differential. They report in their follow-up that there were 304 participants from the villages that received Fresco, 435 who received Atole starting after the age of 3 and 510 from the treatment group who received Atole for the first three years of their lives. However, we can’t find the original size of the treatment groups, so we can’t confirm this concern.
Life-improving effects
The programme has significant 0.3 SDs beneficial effect on mental distress (measured by the SRQ-20, range: 0-20), in a 2017-2018 follow-up, when participants were 40-57 years old, about a half century later (DiGirolamo et al., 2022, n = 1,249)The estimate we use comes from converting DiGirolamo et al.’s (2022) Model 3for full Atole in Table 3 from odds ratio to Cohen’s d. A previous study found a smaller (d = 0.14) but statistically significant. effect (c.f. Table 2) on self-reported meaning and purpose decades later (ages 40-57, Ramirez-Luzuriaga et al. 2021, n = 1,268). We think the discrepancy between these studies could come from the difference in outcomes (meaning and purpose versus distress measured by the SRQ) or because the study doesn’t report a clear treatment effect but instead reports associations in a mediation model. For these reasons we recommend relying on the more recent study. . This effect is very similar regardless of which control group is used – when recipients of Atole at ages 0 to 3 are compared to children from Fresco villages or to children who received Atole after the first 3 years of their life. An effect of 0.3 SDs would be a very large effect, a very long time after treatment. But we have quite a few reasons, which we discuss in the next section, to suggest that this might not reflect the true effect.
Total effect
We assume the effect grows from zero at the age of zero, linearly until the age of 25 years, where it stabilises at 0.3 SDs for the rest of a recipient's life. But this is, of course, uncertain. While DiGirolamo et al. (2022) notes that the intervention had early life benefits for physicalNote that DiGirolamo et al. (2022)says “For example, during the first year of life, each 100 kcal/d of Atole supplement was associated with ∼9 mm in additional length gain and 350 g in additional weight gain; the benefit decreased to ∼5 mm in length gain and 250 g in weight gain during the second year of life.” outcomes, it doesn’t explore whether those with greater short term physical benefits (taller or weighed more) tended to have better mental wellbeing later in life. Despite there being multiple follow-ups, we only found wellbeing outcomes reported for one follow-up, so we can’t use multiple follow-ups to reason about a potential trajectory.
We model this effect to grow linearly from ages 0 to 25, and then persist until death. Once again, this modelling assumption is more conservative than assuming a normal decay model (see figure 3 above for explanation). This gives an effect for the recipient of 15 SD-yearsThe calculation is (0.3 SDs * 25 years * 0.5) + (0.3SDs * (62 years - 25 years)) = 15 SD-years or 30 WELLBYs. or 30 WELLBYsAssuming a conversion factor of 1 SD-year = 2 WELLBYs (please see our cost-effectiveness analysis methodologypage). This effect is massive, but we do not take it at face value, and discount it considerably in the next section. Assuming 16% spillovers (same as with psychotherapy) and a household size (excluding the treated child) of 5.69 implies a total effect of 30 + (30 * 16% * 5.69) = 56.8 WELLBYs per person treated.
There also appear to be huge mortality effects (infant mortality decreases by ~52%)Rose et al. (1992) summarises the effect as the infant mortality rate in the treatment villages was “60 per 1,000 live births, compared with an average rate of 113 in the control villages (p<.05)”. This appears to be quite a large reduction.. The mortality effect, taken at face value, appears comparable to GiveWell’s estimated 45% decrease attributable to CMAM (2024). But we don’t use the Atole mortality benefits – instead we base the mortality effects of CMAM on a GiveWell analysis because it is much more relevant to the effects of CMAM. Also,it seems like there might have been possible confounding factors, like the establishment of health clinics in all the villages during the time of the study (Martorell et al., 2020).
In the next sections we make several adjustments to this effect, mostly in the downwards direction.
Atole-specific adjustment for internal validity
We start with our prior of replicability (internal validity) of 51%, based on the broader social science literature about replications (explained in a footnoteAs we’ve said elsewhere: The adjustment is calculated as a weighted average of the proportion of the size of effect sizes as replicated in replication studies in the broader social science literature: based on the results from Camerer (2018, n = 21), Open Science Collaboration (2015, n = 94) and the Multi-Lab studies (1,2,3,4; n = 77), as reported in Nosek et al. (2022). ). We then adjust this 51% down another 50% (subjectively) because we think the RCT is even less likely to replicate than the average social science literature, leading us to an internal validity adjustment of 0.26 (74% discount). This further adjustment is for several reasons, which inform our subjective adjustment:
- RCT weakness: the RCT has a few issues. Random assignment happened on the village level. There were only four villages randomised to Atole or Fresco, which seems incredibly underpowered. Ramirez-Luzuriaga et al. (2021) explains that out of 300 potential villages, the two pairs were matched on health and socioeconomic characteristics. The village level assignment makes the RCT a cluster randomised control trial but they did not account for the clustering, which could overestimate the standardised effect (Kerry and Bland, 1998). There are also likely selection effects of more malnourished children consuming more Atole than Fresco (Schroeder et al., 1992). While DiGirolamo et al. (2022), also compares older and younger Atole recipients and finds similar effects to comparing treatment and control villages – this only slightly mitigates our concerns (if at all) because being in a younger age cohort could have also been associated with other benefits like receiving modern healthcare at a younger age (Martorell et al., 2020).
- Attrition: The initial sample included 2,392 individuals, but 1,200 were lost to follow-up, which is unsurprising given the duration of the follow-up (40+ years). This is still a massive and seemingly very differential attrition (mentioned above).
- Newness of RCTs: Field RCTs weren’t around for long when they ran the study, so we think it’s plausible they made some basic mistakes we haven’t identified.
- Implausibility: As we discuss later in the famine section, the long-term effects of exposure to famine are 0.06 SDs of harm around 50 years later. The effects of Atole are 0.3 SDs of benefit later in life, implying that the effects of protein supplementation can be 5 times better than famine is bad. This strikes us as odd, or unlikely. But this isn’t decisive, given we also think the estimates of famine’s effects may not be reliably estimated.
Atole-specific adjustment for generalisability to CMAM
Next we consider how the effects of Atole will generalise to the context of RUTF. This is also very speculative but we think overall the effects of RUTF during CMAM would be smaller than for Atole by 59% (a 0.41 adjustment). We came to this adjustment based on combining two conflicting factors related to generalisability. The first suggests that ready-to-use therapeutic food (RUTF) is more effective than Atole, but the second, which we think is more important, suggests the opposite.
- Difference in the average level of malnourishment for the intended beneficiary between Atole and RUTF. Everyone treated by CMAM is, by protocol, malnourished. But Atole was delivered to all children in a village, not all who would have been malnourished. The villages were selected for having problems with malnourishment, but we can’t find specific statistics on the extent of the issueGuatemala has some of the highest rates of stunting in the world (5th worst in the world, OWID 2021). As the World Bank says “In several of the poorest municipalities, the share of households with stunted children under five is often close to 90 percent.” (World Bank, 2024).If we go back to the earliest time we have data for, 1987 (17 years after the study) then the prevalence of stunting was 66% (OWID, 2023). When the intervention was first delivered, the average GDP per capita of Guatemala was $527 – around ten times higher in 2023 at $5,797 (World Bank, 2024). The Guatemala of 1974 would be amongst the poorest countries in the world today (the poorest countries in SSA have GDPcs of $400-600). . Wasting, which we take as a proxy for prevalence of acute malnutrition, was 2% in Guatemala in 1987, the earliest time we have data (OWID). To predict how much of a difference treating non-malnourishedIt appears they include both chronically and acutely malnourished children in their definition of acutely malnourished as the paper mentions the effects on stunted children (i.e., chronically malnourished). Thus those considered non-acutely malnourished also include those who are not chronically malnourished. versus malnourished children, we use the fact that effects on social-emotional, language and motor skills were around 3 times larger (2.91x to be exact) for acutely rather than non-acutely malnourished children as reported in Prado et al. (2021, RCTs = 10, n = 30,024) for small quantity lipid-based nutrient supplements, a similar nutritional intervention to Atole. The adjustment we use here is that the RUTF effects will be around 3x larger than the Atole effects.
- Difference in dosage. While RUTF has more calories on a daily basis than Atole, RUTF is only provided for a couple months while Atole was provided for around three years. This means that a course of RUTF is around a fifth of the total calories and a twentieth of the total protein. We use the total calories and protein as a proxy for dosage between Atole and RUTF. But the adjustment from Atole to RUTF would differ depending on which we assign more weight to (18% the total calories or 5% of the total protein). Based on a relatively uninformed guess, we assume calories matter more than protein so we assign it 70% of the weight and total protein 30%. Taking a weighted average of these differences in dosage based on our intuition for how much they matter results in a 0.14 adjustment (86% generalizability discount). Again, these weights are subjective and averages between the two lead researchers on this project. With more time we would like to discuss with experts their weightings on the importance of each of these categories. Notably, this ignores the complex role that length of time plays. For example, the time component would only be redundant with total calories if human bodies were perfectly efficient at storing unneeded energy, which isn’t the case. We recommend a return to this adjustment in a future version of this analysis.
When we combine these two generalizability factors, one indicating that the effects of Atole would underestimate the RUTF component of CMAM by ~3x, another that Atole would overestimate RUTF by 86%. Together these, lead us to conclude that RUTF’s effects (and thus CMAM’s) will be 2.91 * 0.14 = 0.41 the size (59% smaller). We return to show the effect of these adjustments on the total effect, and compare them to the effect estimates based on other evidence sources, after we’ve finished discussing all of our different estimates.
Adjusted effect
Combining the total effect of 58.6 WELLBYs with the internal validity adjustment of 0.26 and a generalisability adjustment of 0.41 gives a total effect of 56 * 0.26 * 0.41 = 5.23 WELLBYs. The interpretation of this should be the effect of using CMAM to treat one child over their lifetime.
3.3 Estimate 2: Small quantity lipid-based nutrient supplements (SQ-LNS) derived estimate
A related but better evidenced (on non-wellbeing outcomes) intervention to RUTF is providing small quantity lipid-based nutrient supplements (SQ-LNS). Theseare used to prevent children from becoming malnourished, rather than treating malnourished children, as RUTF does. A daily packet provides around 110-124 calories and a suite of nutrients. So a packet of SQ-LNS provides about a fourth (exact content varies) of the calories as RUTF (see Table 3 for a comparison). Compositionally, it is based on the same type of food-based matrix used for RUTF (including vegetable oil, peanut paste, and milk powder) although in smaller quantities (Dewey et al., 2021). It can be delivered quite cheaply. Adams et al. (2023) estimated it costs ~$52 to deliver SQ-LNS to a child for one year.
There has been significant research into SQ-LNS since its development ~15 years ago. Unfortunately, none of this evidence appears to directly measure wellbeing or mental health and is focussed predominantly on short-term effects due to the relative newness of this treatment. However, individual positive effects in the year, or several years following receipt, include reduced wasting (Dewey et al., 2021), stunting (Dewey et al., 2021; Das et al, 2019), anaemia (Cornelius et al, 2019; Das et al, 2019; Wessells, 2021), mortality (Stewart et al. 2020) and improved cognition (Prado et al, 2021).
Total effect
The evidence we use is a meta-analysis of RCTs of the effects of SQ-LNS provided to both malnourished and non-malnourished children in the first three years of life in LMICs (Prado et al., 2021, RCTs = 10, n = 30,024). Note that SQ-LNS can be for moderately malnourished children but CMAM is for those that are acutely malnourished. While Prado et al., (2021) find benefits on many outcomes such as motor and language skills, we focus on the benefits to social-emotional skills and IQ. We think both of these plausibly contribute to later wellbeing, so we try estimating the long term wellbeing effects from both of these pathways and then combine them to get a final estimate. These extrapolations are very uncertain. Again, we used these estimates because we thought we could plausibly convert them into wellbeing benefits later in life. It’s possible that we could have done something similar with outcomes we didn’t explore, like motor function.
Prado et al. (2021) finds a 0.28 SD improvement in social-emotional skills (emotional health, and ability to relate well to others) for malnourished children (i.e., the same population CMAM treats) after they receive SQ-LNS (compared to a control). This is the short-term effect (months after the intervention ended). For non-malnourished children, SQ-LNS still significantly improved socio-emotional skills (by 0.08 SDs). They also estimate that SQ-LNS leads to an overall improvement in IQ of 1.25-5 points, depending on the degree of baseline malnourishment (~1.25 for the more general population, ~5 for those with moderate acute malnutrition at baseline).
IQ effects
To estimate the effect of an increase in IQ, we estimate its impact on wellbeing through IQ’s effect on income. To do this in a shallow way, we use GiveWell’s work, which estimates a 1 point IQ increase leads to roughly a 0.67% increase in income. We take this at face value, but think this is probably not based on causal data, which we attempt to adjust for later.
Based on Prado et al. we assume SQ-LNS treatment improves IQ by 5 points for a child with moderate malnutrition (which we use as a proxy for acute malnutrition). Combining that with the GiveWell estimate means that the incomes will be 5 * 0.67% = 3.35% higher for their lifetime. To convert this to wellbeing benefits, we use Founder’s Pledge (2022)’s work, which estimates that a year of doubling income (i.e., a 100% increase) creates 1.9 WELLBYs. Thus the WELLBY effect of SQ-LNS on wellbeing through income increases would be 1.9 * 3.34%/100% = 0.06 WELLBYs per year. To get the total number of years affected we assume the age where one benefits from increases in income starts at age of 16 and continues to death at 62 (life-expectancy in Nigeria), or it lasts 62 - 16 = 46 years. So the total effect for the individual recipient is 46 * 0.06 = 2.9 WELLBYs.
For spillover effects, we use our cash transfer spillover ratio of 86% (McGuire et al., 2022) since this is also an income effect, and apply it to the average household size in Gombe (excluding the direct recipient) of 5.69, resulting in a total effect over time for the whole household of 2.9 WELLBYs + (2.9 WELLBYs * 86% * 5.69) household members = 17.3 WELLBYs.
This is an analysis we could have spent more time on, but think this is a sensible placeholder estimate. We make some adjustments to this result, which we discuss after the socio-emotional to wellbeing benefit estimate.
Socio-emotional effects
We don’t discuss this estimate in much detail, because we end up using the IQ pathway, since the effects are largerThis follows GiveWell’sdeworming analysis whichonly used the largest estimate out of multiple possible pathways. The intuitive reasoning for this iswe would not expect the total effect of an intervention working through multiple pathways to ever be lower than the highest individual pathway.At most, if the pathways were independent, the total effect would be the sum of effects across paths..
We translate the 0.28 SD socio-emotional effects from Prado et al., (2021) to WELLBYs using Clark et al.’s (2018, p. 22) estimate, based on the British Cohort study. They found that a 1 SD increase in childhood emotional health is correlated to a later 0.1 SD increase in adult life-satisfaction. This implies a 0.28 * 0.1 = 0.03 SD (or 0.06 WELLBY) effect on later life satisfaction, or 2.8 WELLBYs over lifeThe lifetime effect is basedon our established assumption of the benefits growing until age 25, after which they stabilise until the end of life (age 62). We estimate a total effectthrough the socio-emotional (S-E) channel as (0.056 * 25 * 0.5) + (0.056 * (62-25)) = 2.78 WELLBYs. Note that the individual effect alone is comparable to the IQ effect. But we use the 16% spillover rate from psychotherapy (McGuire et al., 2024b) for the S-E channel, which led to a lower total effect of 5.31 WELLBYs compared to 16.4 WELLBYs for the IQ channel. .
We later attempt to correct for its lack of causality.
There’s more evidence we could gather hereWith more time, we’d like to review further evidence on the relationship between early life socio-emotional development and later in life wellbeing such as: Layard et al. (2014), Wood et al. (2021), Stafford et al., (2021), Jones et al. (2015), Nishida et al., (2016), Thomson et al., (2021). There’s also a literature relating emotional intelligence and SWB, e.g. Sánchez-Álvarez et al.’s (2015) meta-analysis (25 studies, n = 8,520) found a 0.32 correlation between wellbeing and emotional intelligence (which we assume to be a closely related concept to socio-emotional development). A similar relationship was found between EI and SWB for adolescents in Llamas-Díaz et al. (2022). , but we deprioritized doing so since we were limited on time, and did not end up incorporating this estimate. We did not incorporate it because we chose the larger pathway estimate (IQ) to represent the effect of SQ-LNS.
Small quantity lipid-based nutrient supplements specific adjustments for internal validity
These estimates are highly speculative. We discount these estimates based on two concerns about internal validity. First, we apply a subjective 15% discount to the results reported in Prado et al. (2021) based on replicability concerns. Prado et al. reports the quality of studies as “high” based on the Grading of Recommendations, Assessment, Development and Evaluation (GRADE) criteria, and that there appears no asymmetry based on inspection of a funnel plot. We remain cautious about these studies, suspecting that a closer examination might reveal concerns. While we’ve adjusted our general assumption of a 51% replicability discount, we still apply a more modest 15% discount to account for potential issues.
Next we apply a subjective 50% discount because both estimates rely on a non-causal link in the model. For IQ, this was the IQ to income link (the SQ-LNS to IQ and income to wellbeing link is causal). For the socio-emotional estimate, the relationship between childhood social-emotional skills and later life-satisfaction was correlational (the SQ-LNS to socio-emotional link was causal). Note that this is a relatively crude estimate of how much of the correlational relationship is causal, so we also consider this a placeholder value.
SQ-LNS specific adjustments for generalizability to CMAM
As we showed in Table 3, SQ-LNS is similar to RUTF in total calories and protein, but notably is delivered over 12 months instead of the 1-2 months for RUTF. There are several ways that could influence how we use it to predict the effectiveness of RUTFs.
We follow a similar approach to adjusting for dosage as we did in the section on Atole where we take the differences in total calories and protein as proxies for differences in dosage that imply different generalizability adjustments. We combine these into a single generalizability adjustment for dosage by giving the caloric adjustment 70% of the weight and the protein adjustment 30% of the weight. However, since both figures are close to 1, the weights here have minimal impact. The implied adjustment here is 0.98 (a 2% discount).
Again, the salient difference is that SQ-LNS is provided for much longer. We’re unsure what impact this may have. On one hand, we think there could be some value in giving a kid some caloric reserves by supplying a higher dose for a shorter period of time. On the other hand, it also seems plausible that spreading the calories out over a longer period of time increases the total availability. For now we make no further adjustment for time, but think this is worth investigating more, with a nutrition expert.
Adjusted effect
For both SQ-LNS estimates we apply a total adjustment of 0.85 * 0.50 = 0.43 for internal validity and non-causal concerns. Then we apply a 0.98 adjustment for external validity for a total of 0.43 * 0.98 = 0.41 adjustment factor (68% discount).
Adjusted effect (IQ pathway)
Applying this to the SQ-LNS → IQ → income → lifetime wellbeing estimate leads to a total effect of 17.3 * 0.41 = 7.2 WELLBYs. Note that the interpretation of this figure should be the impact of delivering CMAM to one child on that child’s wellbeing.
Adjusted effect (Social-emotional skills pathway)
For SQ-LNS → socio-emotional skills → lifetime wellbeing, it’s an effect of 5.31 * 0.41 = 2.20 WELLBYs. This has the same interpretation of the above figure.
We return to compare these estimates to those based on other evidence sources, after we discuss the estimate based on famine (next).
3.4 Estimate 3: Famine-derived estimate
The final source of our estimate of the lifetime effect of childhood malnutrition draws on evidence from studies of two famines:
- The Dutch famine which occurred during the second world war (Van den Broek & Fleischmann, 2017; 1 study, n =673).
- The Chinese famine of 1959-1961 corresponds to the Great Leap Forward (studies = 6, n = 86,424). There are many analyses of this famine, some with overlapping datasets or similar causal identification strategies, making specifying the dependencies complex – an issue we did not have time to satisfyingly address. Huang et al. (2013) uses data from a series of epidemiological surveys conducted in 2001 to 2005. Wang and Wang (2021), Li et al. (2018a) and Li et al. (2018b) all use the China Health and Retirement Longitudinal Study waves from 2011, 2013, and 2015. Ren et al. (2022) and Li and Sunder, (2021) use the China Family Panel Studies dataset.
All of the famine studiesThere are a few more studies we belatedly discovered and did not have the time to extract: Jiang and Jiang (2022), Ren et al. (2023) and Cheng et al. (2021). follow-up with individuals who were exposed in the first years of life (0 to 3). Most participants were surveyed 39 to 57 years later (on average).
The causal estimation strategy typically employed in these studies involved comparing two natural treatment and comparison groups: more and less affected regions, and comparing those who were not very young during the famine (that is they were slightly older or not yet born).
Total effect
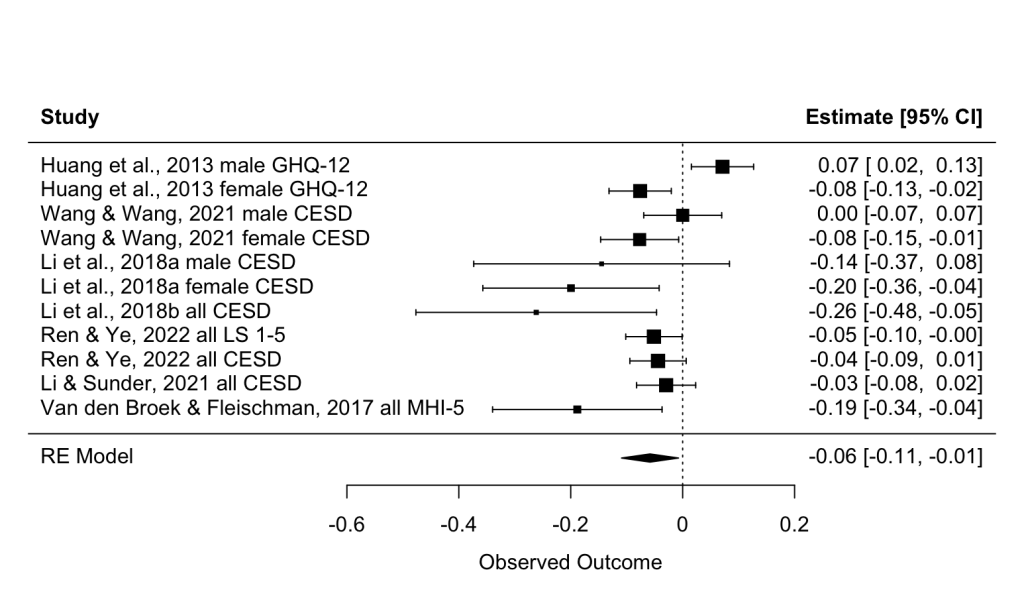
The meta-analytic effects of famine on depression, distress and life-satisfaction are shown in the forest plot (Figure 4) below (measure types noted for each study in the forest plot). In our model, we just control for the dependency between author, outcome and gender reported in a study. This is potentially insufficient given that some studies share causal identification strategies and others share data sources, but we did not have time to perform a more sophisticated analysis. The recorded effect is small, but significant, at 0.06 SDs. However, not all specifications of this model are statistically significant – this is a technical issue we would investigate further with more time.
It’s notable that some of the studies found heterogeneous effects by gender – we attempted to disaggregate where it was relatively easyLi and Sunder (2021) present their results disaggregated by year of birth, making it difficult to provide an aggregate effect.. The heterogeneity is explained as unhealthy boys dying at a higher rate than girls, selecting for more individuals with more robust physical and mental constitutions (Huang et al., 2013). This introduces the possibility of selection bias. The idea is that if we could observe the less healthy boys in old age we’d find larger effects of famine than we currently observe. But this is something we haven’t investigated deeply so we remain quite uncertain about it.
Figure 4: Effect of famine in early life, on MHa and SWB later in life (39-57 years)
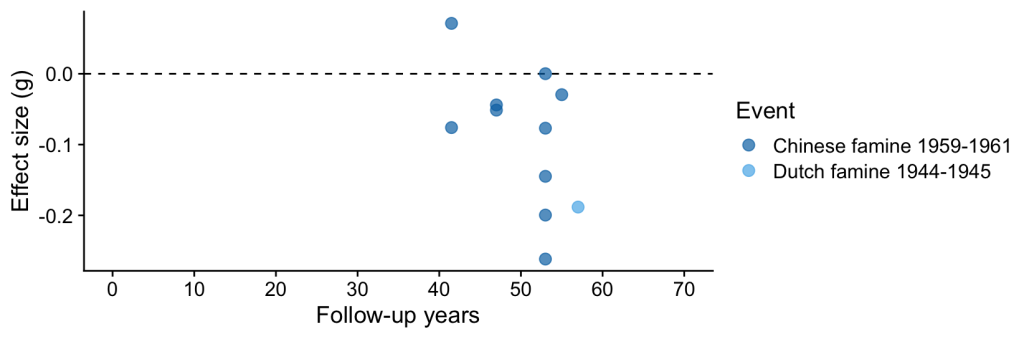
Similar to our analysis of Atole, we assume the harms of famine exposure grow linearly until the age of 25 after which they are constant across the rest of life. Our moderator analysis suggests a negative but non-significant. trendline. We show the results across time in Figure 5 below.
Using this modelling assumption, we estimate a the direct effect to be (0.06 * 25 * 0.5) + (0.06 * (62 - 25)) = 2.98 SD-years or 5.95 WELLBYs. We assume a conservative 16% spillover rate, thus given there are on average 5.69 non-recipient household members the total effect is 5.95 + (5.95 * 16% * 5.69) = 11.37 WELLBYs.
Figure 5: Years since famine exposure and effect of famine exposure
Famine-specific adjustments for internal validity
We start from the assumption that most experiments will have 51% of their effects replicated. This discount is subjectively reduced to only 25% based on the observation that the effects of famine are mostly based on different analyses of the same event, the Chinese famine associated with the Great Leap Forward. So it seems like some amount of replication has already occurred. It also just seems intuitively unsurprising that exposure to famine in childhood would have lifelong consequences for mental health and Nosek et al. (2022) argues that counterintuitive findings are less likely to replicate.
Famine-specific adjustments for generalizability
Famine is related to malnutrition, but extrapolating the effects of experiencing famine to the effects of treating acute malnutrition is obviously very speculative (even compared to extrapolating from Atole and SQ-LNS to RUTF). Indeed, we think these estimates verge on the uninformative.
There are two factors that lead us to think that these effects of famine will overestimate the long-term effects of exposure to acute malnutrition.
First, famine has greater negative effects than malnutrition. As Dikotter (2010) argues in his book on the Chinese famine of 1958-1962, several million of the tens of millions deaths caused by the famine might have been related to political repression and not just starvation. Those exposed to the Dutch famine studied in Van den Broek & Fleischmann (2017) were also under occupation by Nazi Germany. There are myriad other social factors - like group suffering, death of loved ones, etc. - that are more likely to occur in famines, and that could reasonably impact long-term wellbeing. Insomuch as these contribute to the effects of famine we observe in the aforementioned studies, this will overestimate the explanatory power malnutrition has on the effects we’ve observed.
Second, there’s more to malnutrition than acute malnutrition – the treatment of which is the focus of the analysis in this section. Some of the long term effects are likely due to episodes of acute malnutrition, and the rest is due to chronic malnutrition. Here, we’re particularly concerned with the effects of reducing acute malnutrition. Given that the effects of famine represent both the effects of chronic and acute malnutrition, using these would overestimate the effects solely attributable to acute malnutrition.
There are also a few factors that lead us to think that the effects of famine underestimate the effects of exposure to acute malnutrition.
The causal identification strategy used in these studies is about exposure to famine, it doesn’t mean that the individuals in the studies actually suffered from the famine. According to the Integrated Food Security Phase Classification (IPC) for a famine to be officially declared:
- at least 20% of households must face an extreme lack of food
- at least 30% of children must suffer acute malnutrition
- and two adults or four children per 10,000 people must die each day "due to outright starvation or to the interaction of malnutrition and disease"
So potentially only 30% of children that experienced harm due to the famine experienced acute malnutrition whereas all individuals treated by CMAM with RUTF are experiencing acute malnutrition.
The method used to construct the control and treatment groups likely means that many in the control group also experienced some exposure to famine, which biases the effects downward. Take, for example, the years of the Chinese Famine specified in most studies. Some papers assume the famine spanned 1959 to 1961 and thus assign individuals born in 1958 or 1962 to the control group. However, some historians argue that the famine spanned the years between 1958 and 1962. If these alternative dates are accurate, this would indicate contamination of the control group. These factors related to the design would lead to an underestimation of the effect of experiencing famine.
Finally, we think it’s likely that there are selection effects from famine, with the least healthy individuals (who would be the most traumatised) being systematically more likely to be removed from the sample. This selection, through mortality, of what would be our treatment group of exposure to famine, would mean that the effect of famine may be an underestimate. An example of this selection effect is that Gørgens et al. (2012) found taller children (an indication of healthiness) were more likely to survive the Great Chinese famine.
These are all quite complicated factors, and we don’t have much data to use to try and model what they imply for how these effects generalise to RUTF. Our intuition is that these different considerations pushing towards over- and -underestimation mostly cancel out. We think that overall, these push slightly more in the direction of famine overestimating the effects of acute malnutrition. Therefore, we apply a subjective 25% discount, but we are very uncertain about this, and we would be open to revising this with more time.
Adjusted effect
The total discounted effect is therefore 11.37 WELLBYs * 0.75 * 0.75 = 6.39 WELLBYs.
3.5 Summary and synthesis of total life improving effects of CMAM
In the preceding sections, we’ve presented several extremely speculative estimates of the life-improving effects of the RUTF component of CMAM, based on a rather eclectic body of evidence.
We summarise these results below in table 4 and synthesise by assigning equal weight to an estimate from each evidence source. This weighting reflects the fact that each source of evidence has distinct benefits and drawbacks as a basis of our estimate. For the SQ-LNS analysis, we choose the highest identified pathway (in this case IQ) as a conservative estimate, because we would not expect the effect to ever be lower than the highest individual pathway. This follows the methodology in GiveWell’s memo explaining their deworming replicability adjustment.
Surprisingly, our estimates are very similar across sources (especially if we only consider the highest SQ-LNS pathway), but we don’t find this particularly reassuring, given how much speculation we participated in to arrive here. Another reason to only take limited reassurance from the convergence of these estimates is that these results were a product of adjustments that were largely subjective in nature. So, it’s facts as much as intuitions that are responsible for the relatively similar figures. Also note that these are not the final figures for the results. We apply another level of adjustments related to the organisation and delivery in context (discussed in the next section).
Table 4: Estimated effects of RUTF based on different sources of evidence
|
Source of estimate |
||||
|
Parameter |
Atole (Protein) |
Famine |
SQ-LNS (IQ) |
SQ-LNS (S-E skills) |
|
Total effect size (WELLBYs) |
56.84 |
11.37 |
17.29 |
5.31 |
|
Validity Adjustment |
0.26 |
0.75 |
0.43 |
0.43 |
|
Generalisability adjustment |
0.41 |
0.75 |
0.98 |
0.98 |
|
Total adjustments |
0.10 |
0.56 |
0.41 |
0.41 |
|
WELLBYs (adjustments) |
5.94 |
6.39 |
7.17 |
2.20 |
|
Weight on estimate |
33.33% |
33.33% |
33.33% |
0.00% |
|
Average WELLBYs |
6.50 |
|||
4. Organisation: Taimaka
Taimaka is the one organisation delivering CMAM that we found that fits our criteria. We found it due to word of mouth. The sort of organisations we usually look for have several conditions. First, they provide a single intervention (rather than having many different programmes). Second, the intervention seems intuitively cost-effective. Third, the organisation provides us with details on their costs. See our charity evaluation methodology for more detail (HLI, 2023).
Founded in 2019, Taimaka is an impact-minded organisation that provides CMAM treatment in northeastern Nigeria. Taimaka started providing microfinance loans to tackle food insecurity. However, in 2022, after working with researchers from the University of California (Berkeley), they found that their initial intervention didn't meet their own cost-effectiveness criteria. This prompted them to refocus on CMAMTaimaka claims several reasons that they provide CMAM more effectively than other charities in the field. These reasons are: 1. They use the OptiMA protocol. This weight-based protocol, originally developed by ALIMA, helps lower the average number of RUTF packages needed to treat a child from 112 to 65. 2. Digitizing Care. They have a custom-built digital care tool which helps guide treatment staff through the process, and helps them collect better data. 3. Government Partnerships: They cost-share with government healthcare facilities and work with government doctors and nurses. This model results in cost savings and a more sustainable model by avoiding the creation of a parallel healthcare system 4. They claim that leveraging local leadership allows them to think creatively and effectively., and they launched their own treatment program that year. In 2024, Taimaka went through the Charity Entrepreneurship incubation program.
There are two features of Taimaka as an organisation that make it a promising funding opportunity for small grantmakers.
Size
There are many organisations that run nutrition interventions targeting malnutrition. However, the other charities in this space we have identified are typically Multi-Arm NGOs (‘MANGOs’). By MANGOs we mean they run multiple interventions aside from CMAM.
We are reluctant to recommend or even investigate MANGOs. One concern is their multi-armed nature makes it hard to sensibly or easily investigate their impact. We are also concerned about the fungibility of a grant to them. To elaborate, if we ask that a grant be restricted to one arm, the NGO may choose to use the other funds that are made available how they wish. This concern is exacerbated by bigger charities having larger amounts of unrestricted funds.
Given our concerns about fungibility we expect that our funding, even if targeted to a specific programme, will have the impact of the average activity. This gives rise to two problems. First, it is difficult for us to confidently estimate the average impact of MANGOs, which would require assessing each programme. Second, we’re typically interested in the most cost-effective programmes. Therefore, we expect the average cost-effectiveness of a MANGO will be many times less than the particular (cost-effective) programme we are interested in. In short, we worry that funding a MANGO could result in getting a lemon.
In contrast to MANGOs, a grant to Taimaka is non-fungible (transferable to other projects) because they only have one program and a small budget (in 2023 of $328,231). This is the reason for us not looking further into CMAM delivered by mega-charities such as the International Rescue Committee (IRC), which received $21 million from GiveWell in 2021. That and we expect GiveWell to have found and funded the best opportunities that can receive large amounts of funding for CMAM, leaving us better placed to investigate smaller opportunities with smaller organisationsWe intend to write a short-report or blog-post explaining in more depth our concerns about MANGOs and BiNGOs (Big NGOs) in the near future. Our concerns extend beyond fungibility, however this is our most worrisome concern at the moment. .
Innovation
Taimaka’s other advantage is their evidence-based innovative mindset. So far they have five innovations they have tested, or are currently in the process of testing. These include things such as automated phone calls to reduce the high dropout rates common to CMAM programs and using a different antibiotic during treatment.
Perhaps most interestingly, Taimaka is currently running an RCT to test whether providing mothers of the malnourished children it treats with psychotherapy (using the PM+approach) could be a cost-effective addition to itsCMAM intervention. We discuss the psychotherapy element – which will only be added to their programme if it appears to increase cost-effectiveness – in Appendix C.
While not a current part of their work, they also have aspirations to disseminate their research findings and attempt to use them to improve the deployment of larger organisations delivering CMAMTaimaka initially aimed to share their research with large organisations to amplify their impact in the nutrition sector. The idea was based on the recognition that nutrition receives billions in funding for interventions that are not evidence-led. Taimaka hoped to present evidence of ways to increase cost-effectiveness to large implementers. However, they have since shelved this approach, citing challenges in influencing large organisations and concerns over funding. Despite this, we consider it a potential future benefit.. We think this dedication to following the evidence is unusual and encouraging.
4.1 Cost-to-deliver
In 2023 it cost Taimaka $89.09 per child treated (they communicated to us they had a total expenditure in 2023 of $328,231). In 2025 they estimate this will fall slightly to $87.21. We think this is a very reasonable decrease and use this number in our analysis to simulate the effect a grant made now would have. For context, GiveWell estimates that ALIMA (Alliance for International Medical Action) delivers CMAM for $67 per child treated. This reassures us that we aren’t being unrealistic or overly generous to Taimaka.
They report being able to absorb up to $500k in 2025 as they grow their treatment program to reach 9,000 patients, annually.
5. Speculative cost-effectiveness analysis of Taimaka
In the next section, we outline some charity-specific discounts for Taimaka, including a discount for the counterfactual scenario, and the likelihood of them failing in the coming years. After that, we combine the three estimated effects of CMAM with the charity-specific discounts and the cost to deliver CMAM to calculate wellbeing cost-effectiveness.
As a preview, we estimate that the life-improving WELLBYs per $1k (WBp1k) generated by Taimaka to be 65.6. In the final section, we show how we estimate there are potentially 65 additional WBp1k generated from life-saving effects and 3 WBp1k from grief averted. We consider these bonus effects as they are dependent upon some philosophical assumptions we have not solved yet (nor do we expect are soluble).
5.1 Charity specific discounts
There are some discounts that apply to all Taimaka CMAM effect estimates because they relate to the characteristics of the deliverer – in this case, Taimaka.
Primarily we apply a relatively small, 7.4% discount to account for the counterfactual treatment a child might receive anyway without the charity. We use a weighted average of GiveWell’s counterfactual discount for ALIMA, and Taimaka’s own internal discount. GiveWell assumes 65% of cases would have been treated otherwise by the government (in another Nigerian state, Katsina), whereas Taimaka assumes it would only be 8% for the state they operate in, Gombe. We contacted Taimaka about this large discrepancy to see if they could explain their lower figure. They explained that:
“Government treatment programs in Nigeria are run by each individual state, and can vary widely in performance based on state government priorities and how involved UNICEF is in capacity building in each state. The ALIMA program in Nigeria that GiveWell modelled is running in Katsina, where the state government may make more funds available to procure RUTF than where we work. Our estimate is based on the treatment data the state government makes available, which indicate that ultimately relatively few patients are treated in government health facilities.”.
We think Taimaka’s reasoning seems sensible and it is possible for there to be significant variation between states in Nigeria.
The other factor to consider isn’t just how many are treated, but whether they recover. Based on DHIS2 data on nutrition related hospital admissions and discharges in Gombe, we think that those who receive government treatment have approximately a 36% recovery rateWe calculate this by looking at the local government areas (LGAs) Taimaka is not functioning in (every LGA except Funakaye and Yamaltu/Deba) and dividing the total children <5 years treated for SAM by the number admitted for SAM between January 2024 and July 2024.. In comparison, Taimaka recovery rates are around 95%. Under the GiveWell assumption of share treated by the government, we would apply a (36% * 65%) / 95% = 25% discount to account for this counterfactual government treatment or (36% * 8%) / 95% = 3% discount using Taimaka’s assumptions.
We combine these two adjustments (% treated and recovery conditional on treatment) by placing 80% of the weight on Taimaka’s estimate given its higher relevance – this results in a 0.93 adjustment (or 7% discount) for the counterfactual.
Another discount we apply across all estimates is a small 5% discount to account for the chance of Taimaka failing in the coming years. In the case of charity closure, we would expect any grant money to go towards settling debts and closing costs, as opposed to delivering treatments. We do this to reflect that new organisations appear to have a higher risk of shutting down. This feels conservative as there may also be beneficial effects to decreasing the likelihood of failure for an early stage, but potentially impactful organisation.
The total general charity level adjustment is therefore = (1-0.05)*(1-0.93) = 0.88 or a 12% discount.
5.2 Cost-effectiveness estimates
We show the results of our cost-effectiveness estimates based purely on the life-improving effects below in Table 5. Depending on the evidence source we use the cost-effectiveness varies from 60 to 72 WELLBYs per $1,000 donated (WBp1k).
We were unsure exactly how to combine these estimates. For now, we settle on distributing our credences uniformly between different sources. For the SQ-LNS analysis, we choose the highest identified pathway (in this case IQ) as a conservative estimate as we would not expect the effect to ever be lower than the highest individual pathway. This follows the methodology in GiveWell’s memo explaining their deworming replicability adjustment. We found no other clear precedent for combining an estimate that uses different pathways, like we did with SQ-LNS. Our naive averaging reflects our high uncertainty and that each estimate seems plausible.
Table 5: Breakdown of the different Taimaka CEA estimates
|
Source of estimate |
||||
|
Parameter |
Atole (Protein) |
Famine |
SQ-LNS (IQ) |
SQ-LNS (S-E skills) |
|
Total direct effect size (WELLBYs) |
56.84 |
11.37 |
17.29 |
5.31 |
|
Validity adjustment |
0.26 |
0.75 |
0.43 |
0.43 |
|
Generalizability adjustment |
0.41 |
0.75 |
0.98 |
0.98 |
|
Charity level adjustments |
0.88 |
0.88 |
0.88 |
0.88 |
|
Total adjustment |
0.09 |
0.49 |
0.37 |
0.37 |
|
Adjusted effect (WELLBYs) |
5.23 |
5.63 |
6.31 |
1.94 |
|
Cost to deliver |
$87 |
$87 |
$87 |
$87 |
|
WELLBYs per 1k |
60.0 |
64.5 |
72.4 |
22.2 |
|
Weight on estimate |
33.33% |
33.33% |
33.33% |
0.00% |
|
Average WBp1k (life-improving) |
65.6 |
|||
Thankfully, these estimates, while stemming from very different starting places, all indicate that Taimaka has a promising cost-effectiveness (reasonably more than the 7.55 WBp1k of our benchmark, GiveDirectly cash transfers). However, this relatively narrow range belies the true uncertainty we have in these estimates for several reasons, which we discuss in the next section.
So far, we’ve only discussed the life-improving effects of CMAM, but it’s worth noting that as GiveWell estimates, CMAM reduces the risk of death by ~46% (2024). We present the potential mortality effects of CMAM delivered by Taimaka in Appendix D. They range from 0 to 65 WBp1k depending on one's view. This acts as a potential increase in cost-effectiveness that some donors may wish to account for.
6. Evidence quality and depth
We characterise the evidence quality as weak, and thus the analysis that’s based on it as speculative.
We provide or assessment of evidence based on the widely used GRADE (Grading of Recommendations, Assessment, Development and Evaluation) framework, as we explain on our website. See this article for a brief overview.
The highest quality of evidence is characterised by good study designs (e.g. RCTs), low risk of bias in the studies, precisely measured effects within studies, low variation between studies, high relevance to the real-world context, and low publication bias. We will go through each of these factors in turn.
Study design: Our evidence we draw on relies primarily on studies with a causal identification strategy (RCTs and natural experiments). But we sometimes rely on correlational evidence, as was the case with predicting the wellbeing effects of SQ-LNS.
Risk of bias: Risk of bias means that the overall evidence is only considered low risk if the weakest piece of evidence is low risk. In our case, we believe that at least the Atole evidence we would use is high risk of bias due to significant attrition.
Imprecision: Some of our evidence has imprecisely measured effect sizes (e.g. the effects of famine). Still, each evidence source is generally relatively powerful (sample sizes greater than 1,000), compared to evidence we have considered for many other interventions.
Inconsistency: As we illustrated in Section 3, many of the estimates within and across evidence sources vary substantially, which should undermine our belief in their credibility.
Indirectness: The evidence we use is quite indirect. CMAM lacks direct causal evidence. Instead of relying on direct causal evidence, we have to extrapolate from other sources of evidence about the causal wellbeing effects of malnutrition. This extrapolation is made uncertain because the exact mechanism through which CMAM improves long-term wellbeing is unclear.
Publication bias: We did not assess publication bias in this analysis. It’s also not possible for small study sizes. In the absence of evidence against publication bias, we tend to assume the worst.
For the reasons we outlined above, particularly the high degree of indirectness, we rate the evidence quality as weak.
We also rate the depth of work that went into creating this estimate as low. By this, we mean that we have reviewed only a portion of the relevant available evidence on the topic and have completed just 10-60% of the analyses we consider necessary. There seems to be much more evidence and analysis that could be applied (c.f. Appendix E), although we are not sure what it would be. Another way of expressing this, is that we view this report as shallow. For example, the first author put ~80 hours into this report – our most in-depth reports might have absorbed 5 to 10 times as much time.
7. Conclusion
We estimate that Taimaka is cost-effective (66 WBp1k), but we recognize that our cost-effectiveness estimate is extremely speculative. It relies on weakly relevant evidence, which we immodestly extrapolate from, to arrive at estimates of the effect of treating acute malnutrition with RUTF. We have very low confidence in the stability of estimates. The low confidence reflects our views that this was a shallow investigation of a complex topic and we thus think these estimates are liable to change with further research or expert review.
We compare the cost-effectiveness of Taimaka to other charities on our web page here.
Further, we think that a person who places a high value on saving a life could endorse a higher total cost-effectiveness value of up to 137 WBp1k for Taimaka (c.f. Appendix D).
However, all of these caveats aside, we think these estimates are still somewhat informative. By “somewhat informative” we mean that they provide us (the co-authors) with a sense that CMAM may be cost-effective. That is, it could be something donors choose to credibly support (particularly if they have strong beliefs about the badness of malnutrition), and it may be worth investigating further. Some of this intuition is supported by our general view that acute malnutrition seems like a top contender for things that permanently impair wellbeing.
We think it’s somewhat reassuring that ex-ante malnutrition probably stunts wellbeing, and it seems reasonable that the delivery of CMAM can be done for $87 per person, given that ALIMA has already delivered at $67 per child treated.
Note that we only attempted to estimate the life-improving effect of one component of CMAM: the provision of RUTF. We did not estimate any benefits that come from the general medical care provided to malnourished children, which could mean we are underestimating the cost-effectiveness. This factor makes us think it’s less likely we are overestimating the effectiveness of Taimaka.
On the organisation side, we appreciate Taimaka’s interest in pursuing evidence-led interventions, and the potential to use their research to influence larger organisations. We also have a positive impression of their competence and transparency. Finally, the fact they are small and currently in the growth stage puts them in a position where our audience of grantmakers is well-placed to assist.
All of these factors incline us to think that Taimaka could be a good funding opportunity despite the high levels of uncertainty in this CEA. However, while we think our analysis supports some amount of funding, we don’t think it implies torquing the firehose valve of funding. This inclination towards restraint is due to our very high uncertainty and not particular concerns.
To resolve this uncertainty, we think further research on the long-term wellbeing effects of malnutrition (or treating it) would be quite valuable. We think the most promising opportunity to cheaply improve our understanding would be to fund adding wellbeing modules to any future follow-ups of the largest SQL-LNS trials. In Appendix D, we discuss this idea in more depth, as well as outline some areas for more research on broader nutritional topics.
Appendices
Appendix A: Search strategy and literature review
There is an immense amount of research on nutrition’s effects and relationship to health. We tried to be reasonably exhaustive, but we consider this a rather quick and shallow review that potentially missed important papers.
In this section, we discuss:
- Our general search strategy for finding nutritional interventions and organisations.
- Interventions we don’t explore in depth (for various reasons).
A1. Search strategy for evidence
For the evidence review, we used a non-systematic search strategy, which we explain here.
We used Elicit and Google Scholar to look for meta-analyses, reviews of childhood development interventions, and specific studies of the long term causal effects of a nutritional intervention. For example, we searched through the citations listed in “The Effect of Malnutrition and Micronutrient Deficiency on Children’s Mental Health” by Grantham-McGregor and Smith (2020) – which seemed like it should have any important articles on the topic because it was a review involving prominent researchers in the field. In general, we search through the description of each article included in the review to see if it included MHa or SWB outcomes. We did not look through full articles but used summary information taken from abstracts. It’s possible that we missed some studies in doing this.
We then, using Google Scholar, searched for articles that cited these reviews (like Grantham-McGregor and Smith (2020), and looked through the titles to see whether they clearly included MHa or SWB outcomes. We also searched for individual RCTs or natural experiments, and followed a similar search strategy. When we found a study that held MHa or SWB as a primary outcome, we looked through the studies it cited, and the studies that cited it using Google Scholar.
The evidence we reference here is very likely inexhaustive. More studies could be collected and they could potentially shift our conclusions.
We spent 10-15 hours searching for studies. We stopped when we felt reasonably confident we had relatively exhausted the sources we could find with a non-systematic search.
A2. Search strategy for finding organisations
We didn’t have an organised or systematic search strategy for organisations delivering nutritional interventions. We pursued a combination of the following:
- Word of mouth. We asked for references to organisations that seemed promising from other researchers or grantmakers working in the effective giving or broader global health and wellbeing space. This is how we came across Taimaka, which we evaluate in a shallow manner.
- Looking for organisations already mentioned in existing reviews of nutrition interventions such as those published by GiveWell.
- Previous knowledge: we were already aware of Fortify Health, which is also a GiveWell grantee.
- Searching for organisations delivering a promising intervention. This was mostly done with Google, which was generally fruitless, given how very large charities dominate the search engine optimisation (SEO) algorithms for broad nutrition interventions addressing malnutrition.
Next, we’ll discuss some of the topics we found no evidence on, before moving on to the interventions we think were most promising to explore.
A3. Interventions we aren’t focusing on this report
There are interventions we didn’t investigate further because:
- The evidence is for mortality but not for life improving effects.
- We found no wellbeing evidence (i.e. no studies).
- There is evidence but it found null wellbeing effects.
- There’s only short-term wellbeing benefits and it doesn’t seem cost-effective, based on existing evidence.
We open our file drawer and discuss the interventions we don’t pursue further in Appendix B.
Appendix B: The file drawer
Interventions with primarily mortality effects
Nutrition interventions are often assumed to increase wellbeing through saving lives, but this is beyond the focus of our project to investigate in depth, and not a primary focus of HLI more generally.
Take Vitamin-A supplementation, for example. GiveWell, using the meta-analytic effects on childhood mortality, finds that delivered by Helen Keller International it’s more cost-effective than the anti-malaria bed nets provided by AMF. Given that if one places a high value on saving lives, and AMF is already amongst one of the most cost-effective ways to increase wellbeing, then Vitamin-A provision is at least as cost-effective as AMF, if not moreso.
Interventions with only short term effects on SWB
In our general evidence exploration, we came across two nutritional interventions that only provided short term evidence of a benefit. The studies also didn’t strike us as constituting particularly strong evidence or for indicating a cost-effective intervention if we took the evidence seriously. These interventions are:
- Micronutrient supplementation: 1 RCT from mainland China (n = 2,730), 1 RCT in India (n = 347)
- Supposedly nutritious school lunch subsidy: 1 RCT from mainland China (n = 4,397).
Micronutrient supplementation with multi-vitamins may have at least short term effects on mental wellbeing. Zhang et al. (2013) analysed the effects of providing multivitamins (see Supplemental 1 for content) to children aged 10-12 with a high level of anaemia at baseline (42.4%) for a year (n = 2,730). They find a small (0.13 SD) effect on anxietyThe anxiety test involved covers many domains related to learning and social situations (see supplement 1) and doesn’t appear primarily focused on general anxiety. But the authors seem to think it covers general anxiety: “from the General Anxiety Test developed by Kiyoshi Suzuki in Japan (38). These tests are variations of the Children's Manifest Anxiety Scale, which is an internationally standardised test for anxiety in children that has been widely used in the United States and other developed countries (39)”. after the intervention ends (no long-term effects).
They report nearly perfect compliance, which probably doesn’t generalise. After searching Google, we would estimate the cost of multivitamin supplementation is around $10-$20 per person for a year. We assume in this circumstance that supplementation needs to be continued for effects to persist. In which case, the cost-effectiveness would be between 7 and 14 WBp1k if we apply a standard 50% replication discount to the effect size. This does not appear a particularly promising level of cost-effectiveness. So, in concert with finding no promising organisations focusing on micronutrient supplementation, we did not explore this option further.
Satyanarayana et al. (2024) found an effect of vitamin-D supplementation on depression for adolescents in India, but it’s a relatively small sample (n = 347), and so we do not update much on it.
School lunch subsidies may have at least a short-term effect on wellbeing. Luo et al. (2019) find a small (0.081 SD), short-term effect (no long-term follow-up) of a ~$64 subsidy for school lunches. Based on a brief BOTECConverting the 0.08 SD effect to WELLBYs implies the intervention creates 0.08 * 2 = 0.16 WELLBYs. Using our typical assumptions for 16% spillover of mental health effects and a non-recipient household size of 3, we estimate this would produce 0.16 WELLBYs + (0.16 WELLBYs * 16% * 3) = 0.24 WELLBYs in total. Which at face value would mean 0.24 * (1000/64) = 3.7WBp1k. If we also applied a 50% replicability discount, this moves the CE down to ~2 WBp1k. we found that this would imply a low cost-effectiveness of around 2 WBp1k, so we didn’t pursue this line of research further.
Interventions and events with null effects
We found quite a few interventions with no statistically detectable effect, which we mention for completeness. It’s unclear whether this is due to no true effect or there being insufficient statistical power (and the effect is just small).
- Exposure to iodine supplementation in utero has no effect on the likelihood of being diagnosed with a mental disorderTable 5, page 13, the effect was –0.0001 (0.0005) with n = 1,246,242. Since FP has a cause area reporton education where they recommend funding charities that provide salt iodisation, this is confusing. It’s a puzzle if salt iodisation increases schooling and schooling is good. One possibility is just that it increases likelihood of non-mood disorders, but decreases likelihood of mood disorders, but that seems unlikely. The estimates are very precise around zero. Additionally, diagnosis of mental health disorders might be too stringent and too coarse an outcome compared to increases in affective mental health symptoms. (Araujo et al. 2021).
- Banerjee et al. (2018) found null short term MH effects of iron-fortified salts to treat anaemia (a supplement recommended by evidence action). The estimates also had mixed signs across models and specifications, so it is probably not cost-effective even if we took the imprecise effect sizes seriously.
- DiGirolamo et al. (2010) study the effects of a 6 month RCT of zinc implementation on mental health and find no consistent treatment effect (n = 674). They found an association between zinc concentration and depressive symptoms in one specification but we’re inclined to treat this as noise. For similar interventions there’s mixed effects on developmental outcomes from Cochrane analyses (Gogia et al., 2012; Imdad et al., 2023) – so it’s not clear that we should have a prior of efficacy in the first place.
- Exposure to fasting while in utero, due to Ramadan fasting has mixed effects on SWB and MHa. Kim (2014), studied 36 year olds in Indonesia and found small effects on height and weight, large negative effects on income (-11.4%) and education (-3.8%) but surprisingly null effects of fasting on childhood mental health or subjective wellbeingPage 37: “The vast majority of coefficients are not statistically significant, with three being marginally significant and two being significant at the 5% level of significance. However, all five of these coefficients are not in the expected direction and are scattered across the regressions for four different measures. Again, as we are estimating 30 coefficients, we would expect to see one to two coefficients reach the 5% level of significance and three coefficients reach the 10% level of significance through chance alone. The results here are in line with the significance of the coefficients being generated randomly, and do not show any systematic patterns.”. Almond and Mazumder (2011) found that exposure to fasting in utero during Ramadan in Uganda led to a relatively higher likelihood of having a mental or learning disability as an adult at age 58Note that this is outside of normal inclusion criteria which is concerned with self-reports of people’s mental wellbeing and aspects of mental health directly related to mood. . Chen (2017) finds negative effects of exposure to fasting whilst in utero on life satisfaction on 40 year olds. We did a meta-analysis of these studies and found the average effects of Ramadan fasting are non-significant and close to zero after 50-60 years (-0.01, 95% CI: -0.04, 0.01).
Interventions with no direct wellbeing evidence
This is a bit of an empty category, as it depends on us searching for wellbeing evidence for specific interventions.. We found no directly relevant evidence (after ~7 hours of searching) for two well studied ways to address malnutrition:
- Ready-to-Use Therapeutic Food (RUTF)
- Small quantity lipid-based nutrient supplements (SQ-LNS).
But while we found no direct evidence of wellbeing evidence related to these interventions we found enough related evidence (discussed next) to investigate interventions involving RUTF or SQ-LNS in more depth.
Appendix C: Other organisations tackling acute and chronic malnutrition
Given the size and scope of organisations generally trying to address malnutrition with CMAM or related protocols, it’s worth mentioning some of the other organisations we’ve considered that are trying to attack the problem generally. However, we aren’t sure what organisation would be the runner-up in terms of promise if Taimaka were not an available funding opportunity.
As we’ve already established (but is worth reiterating), there are seemingly purely life-saving interventions like Vitamin-A supplementation (which is cost-effectively provided by Helen Keller International). However these are outside the scope of this report, and currently not a strategic focus of HLI more broadly as we think other organisations like GiveWell have a comparative advantage at evaluating and recommending life-saving opportunities.
GiveWell has granted to CMAM programmes delivered by the International Rescue Committee and ALIMA, indicating their potential cost-effectiveness. But we don’t think there’s much value in re-evaluating funding opportunities already reviewed by GiveWell, so we don’t consider these organisations.
Outside of GiveWell evaluated opportunities, there are a huge number of possible charities implementing nutritional interventions. Food aid is in some way, the stereotypical philanthropic intervention. However, many of these interventions are delivered by ‘mega-charities’, and so the content of the programmes (much less their cost) is quite illegible. For example the World Food Program has a first “1000” day program, but it’s unclear what their “specialised food” contains. There are similar issues with Save the Children, Phase Worldwide and Doctors With Africa. For this reason, we didn’t pursue evaluating any programme attached to a very large charity. We aren’t categorically opposed to doing so, but we decided it was not worth our limited time.
Another approach we took was, due to the striking potential effects of the Atole RCT, to see if there were any organisations deploying an “Atole-like” intervention. The clearest analogy we found to the Atole protein supplementation programme was the provision of Nourimanba, “a peanut-based, vitamin- and mineral-rich supplement” (Partners in Health (PIH)), by Partners in Health in Haiti and their Haitian Partner organisation Zanmi Lasante. However, we don’t know any further details of the programmeDetails are difficult to find. Elsewhere they say “PIH produced 83,250 kg” of Nourimanba, but it’s unclear over what timeframe or how many children this would feed. In 2022 PIH received $335.3 million and spent $243.5 million, with 24% of the spending going to Haiti, where their programmes include education, mental health, and maternal-child health in addition to their work on malnutrition. 68% of their revenue comes from individual and family foundations. and neither PIH nor Zanmi Lasante has responded to our emails. On reflection, we think this is probably an attempt at a home-grown RUTF, so it’s not clear if we’d end up thinking its efficacy was very different.
Two more charities seemed potentially promising. We found them through word of mouth and searching, but it seems less likely that they have a funding gap.
Edesia is a producer of RUTF, most of which it claims ends up in Sub-Saharan Africa. USAID provides 73% of its funding, and another 14% comes from UNICEF. In 2021 it estimated that it reached 2.5 million children. But it’s unclear what this means (does it mean 2.5 million children took a nibble or were fed for months?). Their finances put them in a remarkably good position. In 2021, they spent $6mil, but received $14 mil from sales profit and grants, and ended the year $7mil richer than they started, ending up with a total of $39 million by the end of the year. We think this puts them in the “too rich” category to be able to usefully absorb further funding, so we didn’t look into them further. Note that we don’t have a well-defined category of what “too rich” requires or entails.
Essential is a bioscience organisation, operating in East Africa, attempting to create cheaper proteins through fermentation to combat malnutrition. However, we’ve been told by some grantmakers (who we haven’t confirmed if we can disclose) that it doesn't have a funding gap, so we didn’t look into it further.
Appendix D: Early life malnutrition
Studies of the Barbados Nutrition Study (BNS; Galler et al., 2010; Galler et al., 2013; studies = 2, n= 116), which is a longitudinal follow-up of a small sample of infants hospitalised for protein-energy malnutrition between 0-1 years (between 1967 and 1972).
The follow-up studies we reviewed involved matching children who had experienced malnutrition with children from the same classroom based on sex, age (within 3 months), and right- or left-handedness. It’s worth emphasising that it doesn’t appear as if the control group was formed based on any further observable characteristics. The two constructed control and treatment groups were then compared 14 and 40 years later.
There are several problems with the approach employed in the study. Firstly, there’s no plausible source of random assignment to malnutrition here. It’s extremely likely that children who were hospitalised for malnutrition differed from their healthy control group in other ways unrelated to sex, age, and handedness. For instance, it seems like a parent's socio-economic status, which presumably varies amongst students in a classroom, plays an important role in the risk of malnutrition. Furthermore, even if there was a rich set of observable characteristics to match on, it seems unlikely that classrooms would provide a large enough pool to find close matches based on observable characteristics. And finally, for our purposes those who never experienced malnutrition aren't the relevant control group. We would like to compare the lifetime trajectories of those that received more or less effective treatments for malnutrition because we’re interested in estimating the effects.
Overall, we find a loss of wellbeing of -0.66 (95% CI: -0.95, -0.37) SDs across the BNS studies (shown in Figure 8 below).
Figure 8: BNS study outcomes
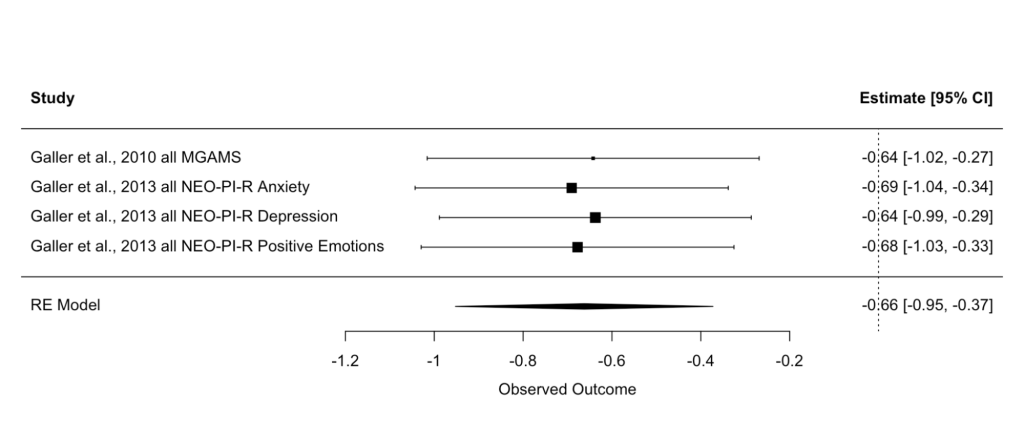
Notably, the BNS finds a much larger effect than famine, which has a smaller effect of -0.06 SDs. We suspect the BNS coefficient is larger for several reasons:
- First, we interpret the effects of the BNS study as basically correlational, and it seems like these are driven in part by unobserved confounders related both to risk of malnutrition and lifetime mental wellbeing (e.g., poverty in childhood).
- Second, not all those who are exposed to famine in childhood suffer SAM whereas every child in the BNS study did.
- Third, those who did suffer SAM in famines are unlikely to have received much medical treatment due to how widespread the issue was. Thus, mortality would have been higher, leading to greater selection effects for the most healthy, compared to those in the BNS study who all received treatment.
This information potentially provides us with evidence about the effects of preventing acute malnutrition, but is less relevant to estimating the effect of treating malnutrition. As we noted, the causal claims of this evidence are perhaps the weakest of all our different estimates. That said, we still think this provides some weak evidence indicating the badness of malnutrition, simply because the differences in SWB are very large for differences between peers in a classroom.
Figure 9: Distribution of the effects of malnutrition over time
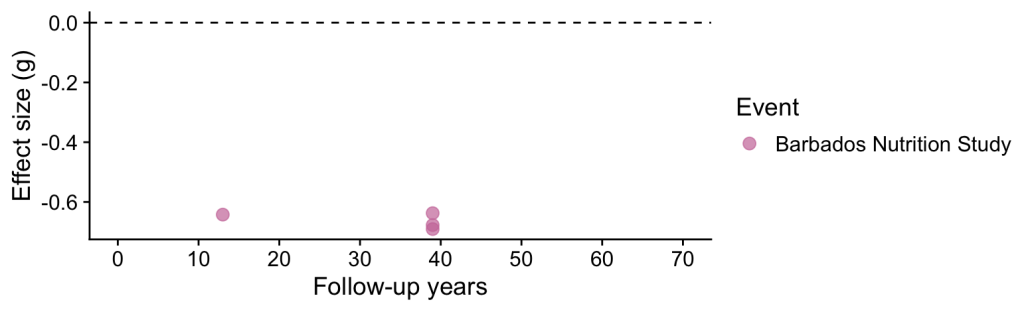
Appendix E: Maternal depression and malnutrition
There is evidence in the literature that there are very high rates of depression among mothers of malnourished children. For example, Haither et al, (2018) find the prevalence of moderate to severe depression among mothers of malnourished children was 64.1%, compared to mothers of normal weight children 5.1%. Because of the high proportion of mothers with malnourished children who suffer depressive symptoms, Taimaka believes it might be cost-effective to treat mother’s who are already coming in for treatment for their children with psychotherapy. Moreover, there is evidence in the literature that poor maternal mental health can impact child malnutrition (Bauler and Davis, 2020), so they hope by targeting maternal mental health they can also further improve the effectiveness of CMAM. If this RCT turns out to be a success then it is possible Taimaka might add psychotherapy to their treatment at a very low marginal cost (mothers are already coming in, and Taimaka’s overheads will hardly change), and thus boost their cost-effectiveness significantly.
Appendix F: Potential mortality benefits for CMAM
As we’ve previously explained (Plant et al., 2022), the badness of death depends strongly on one’s philosophical views. We assume the typical stance for decision-makers who place a high value on extending life is approximated by two factors. The first is deprivationism – which claims the benefit of a life saved is the happy years recovered. The second factor is thinking that the neutral point (where wellbeing would be neutral) on a 0 to 10 life-satisfaction scale is 2, the value that’s our best guess at what further empirical work will converge on.
Using our estimate of Nigeria’s life expectancy (62 years), and their average life-satisfaction adjusted for expected increases in satisfaction over time (for an average of 5.72 on a 0 to 10 scale), we estimate that a life saved with CMAM in Nigeria provides 62 * (5.72 - 2) = 231 WELLBYs.
We adapted both GiveWell’s life-saving evaluation of CMAM (delivered by ALIMA) and Taimaka’s own internal analysis to model the WELLBY effect in terms of life-saving.
There is a considerable difference in the estimated lives saved in GiveWell’s ALIMA work and Taimaka’s own CEA. This is primarily due to the already mentioned large difference in the counterfactual discount. Once we adjust for the counterfactual, we end up with an estimate of the life-saving benefit alone (for a deprivationist) to be 56 WBp1k from applying Taimaka data to GiveWell’s (wellbeing adapted) analysis, and 76 WBp1k using Taimaka’s (wellbeing adapted) analysis.
The difference in counterfactual discount explains 59% of the difference between the estimates, but we are unsure as to the complete explanation for why they differ. We suspect most of this is because GiveWell is looking at a different charity, working in a different place, with a different caseload (Taimaka almost exclusively treats SAM cases, where as only ~40% of ALIMAs caseload are SAM) so some variation is expected. Due to time constraints, the fact our focus is primarily on life-improving WELLBYs and the difference is not too great, we did not explore this further. We think that GiveWell’s model is less likely to suffer from bias than Taimaka’s. But it is also less relevant to Taimaka. So we combine the results of both estimates by assigning equal weight to each. The result of combining these estimates is 65 WBp1k assuming deprivationism and a neutral point of two. Again, we characterise this as the view that someone who places a high value on saving a life would take.
There are also a small additional number of WELLBYs generated by avoiding grief. We use the same methodology for grief here as in our AMF report for comparability (c.f., Plant et al., 2022). Using the same results, but applying it to a larger household size, we estimate that grief has a 10.24 WELLBY loss for the whole household. Alternatively, using our previously calculated estimates for lives saved per $1k, we calculate that avoiding grief adds 2.88 WBp1k to the cost-effectiveness. Note that these are life-improving WELLBYs (so not subject to the same philosophical concerns of life-saving WELLBYs), however we calculate and discuss these here because a) they are conceptually linked to averting mortality and b) there are also some difficult questions related to grief that we have not answered yetFor example, if saving a person now makes it harder to lose them later, is that a good thing? Some people might argue losing a very young baby is less emotionally difficult than losing a teenager because they have fewer and weaker connections to others. Moreover, even if the grief is worse now or just as bad as it will be in the future, it will definitely happen in the future so we aren’t really averting that suffering, just delaying it.. Nonetheless, we include these effects for those interested.
If we add the life-saving and grief-avoiding benefits, the cost-effectiveness increases from 66 WBp1k to 134 WBp1k for what we take to be the typical view of someone who’d place a high value on saving lives. Note, this is not information we incorporate in our primary CEA analysis. We typically want our funding opportunities to be robust to differences in views on the badness of death – but we consider a large additional life saving benefit like this as a qualitative bonus.
Note that the “typical stance” could be construed as the “best case” scenario for the life saving benefit. The “worst case” scenario for the value of saving a life would be zero benefit, reflecting an Epicurean disbelief in the badness of death (c.f. Plant et al., 2022). In the “worst case”, the effect will just be the life-improving effect we provide in our primary analysis.
Appendix G: Research opportunities
G1. Long run wellbeing effects of SQ-LNS
Recall that small quantity lipid-based nutrient supplements (SQ-LNS) are used to prevent children from becoming malnourished, rather than treating malnourished children, as ready-to-eat therapeutic foods (RUTF) does. They are based on the same type of food-based matrix used for RUTF (including vegetable oil, peanut paste, and milk powder) although in smaller quantities (Dewey et al., 2021). It can be delivered quite cheaply.
There are several reasons we think that further research on the wellbeing effects of SQ-LNS is the most promising path to understanding the wellbeing effects of treating malnutrition. First, out of the three evidence sources, we think that SQ-LNS was the most similar to RUTF, meaning it requires the least extrapolation. It also has the best causal evidence surrounding it. Prado et al., 2021, studied 10 mostly high-quality RCTs with a total sample of 30,024 – while RUTF, on the other hand, can’t be causally studied without recourse to a natural experimentWe were not able to find any natural experiments that studied RUTF exposure, or that could be used to study RUTF – but this of course remains an option. . Lastly, we think that the existing SQ-LNS trials afford long-term follow-ups. Indeed, we think it’s quite plausible that there are likely long-term follow-ups of (large) SQ-LNS trials that are being planned, or will be planned soon. If that’s the case, then it also seems possible to fund them to add a wellbeing module.
Further research in this direction would be to review the SQ-LNS RCTs. Starting with the largest ones, asking the relevant authors whether they A) plan on doing a follow-up (and how old would the children be at the follow-up), and conditional on there existing plans B) how much would it cost to add a wellbeing module to a follow-up. If the children are old enough to answer self report questions about their mental wellbeing, and the costs are reasonable (unclear but my guess is $10k to $30k), then this seems like a potentially promising research opportunity to fund.
G2. Long run wellbeing effects of better general nutrition in India
Dhamija and Sen (2020) studied the long-term health effects of exposure to “the Integrated Child Development Services (ICDS), the largest national programme in the world targeting long-term nutrition and holistic development of children” in India. The data from the survey, 7 to 10 years after exposure includesCtrl + f “mental”.
, the likelihood of being diagnosed with a mental illness. However, the long-term effects of the ICDS program on these mental health measures have not been evaluated. It seems plausible to replicate the results of the original study on health. If the study replicates, then it seems worth expanding the analysis to the mental health effects. This would provide some of the only causal data on the impact of a nutrition program on mental health later in life.Regarding data accessibility: In Dhamija and Sen (2020) they say “The IHDS-2 data, used in this work, are publicly available to bonafide researchers at the link cited in the paper. We would be happy to share the instructions and Stata codes to researchers that could be used to generate the required variables and replicate this exercise.”
Additionally, the Andhra Pradesh Children and Parents Study (APCAPS) study (n = ~1k) in India followed up after ~20 years and contains, but did not study, mental health outcomes (Nandi et al. 2018). From correspondence, it appears as if the authors of Nandi et al. may be interested in our research questions and could be open to doing further work on the topic.
G3. The long term effects of protein and caloric supplementation on wellbeing in Guatemala: insights from the INCAP study.
There have been at least three studies that look at the effects of early life exposure to Atole, a protein and calorically rich beverage, on wellbeing measures nearly 5 decades later.
- The programme has large effect on mental distress (SQR-20) about 50 years later (DiGirolamo et al., 2022, n = 1,249)
- Varghese et al. (2021) studies the association between happiness and subjective socioeconomic status, but does not analyse the direct treatment effect of exposure to the Atole programme in the first 1000 days.
- Ramirez-Luzuriaga et al. (2021) studies the associations in a mediation model between Atole exposure and self-reported meaning and purpose decades later (ages 40-57, n = 1,268)but the study doesn’t report a clear treatment effect.
Since two of the three studies do not report a direct treatment effect, it would be useful to conduct a single analysis to assess the treatment effect across all available wellbeing measures. This should include exploring any population heterogeneity and examining whether the effects change over time if wellbeing measures are captured at multiple timepoints.
Data availability: The data is not open access. DiGirolamo et al. (2022) says
“The datasets generated and/or analysed during the current study are not publicly available. There are ethical or legal restrictions on sharing a de-identified data set. We cannot anonymize the data from this cohort as all individuals come from 1 of 4 previously named villages and hence are readily re-identifiable once their demographic characteristics are known. We will not post data to a public archive, but we will make a replication data set available to bona fide researchers who agree to sign a Limited Data Use Agreement (LDUA) and are covered under an IRB.”
They then list the contact information in the article. Access to the data requires signing a LDUA and coverage by an IRB, but this could potentially be overcome.
G4. Miscellaneous further work to review
Some further work could explore the following studies for more causal evidence on better childhood nutrition and long-term wellbeing.
- There is an RCT in Vietnam testing preconception supplementation for pregnant women and the effect on the children. It has no effect on birth outcomes (Ramarishnan et al., 2016). However this meta-analysis by Saccone & Berghella, 2016, does find improvements for preconception supplementations in general. Yet they do find improved motor skills for two year olds (two years later) (Nguyen et al., 2017) and intellectual development at 6 years old (and later) (Nguyen et al., 2021). They did not collect or report SWB or MH outcomes, which makes sense, given the children were very young.
- There are many studies with long-run follow-ups of small quantity lipid-based nutrient supplements (SQ-LNS), which seem more like the intervention studied in the INCAP study. It seems plausible that there will be future follow-ups and we could fund the inclusion of MH / SWB measures. For example: Susana et al. (2017) in Bangladesh, Bentil et al. (2024) in Ghana. Indeed Prado et al. (2023), when describing the results of SQ-LNS “The lack of effects may be owing to low prevalence of social–emotional problems at preadolescence, resulting in little potential to benefit from early nutritional intervention at this age in this outcome domain. Follow-up during adolescence, when social-emotional problems more typically onset, may yield further insights.”
- We noted that evidence of salt iodisation in Araujo et al. (2021) found no effect, the outcome was somewhat indirect. We could potentially study more directly, using early life exposure to other salt iodization programmes, such as: China’s salt iodization programme (Huang et al. 2020; Deng and Lindeboom ,2022); Adhvaryu et al. (2020) in the USA or Tafesse et al. (2022) India.
- Aurino et al. (2023) studied the randomization of Ghana’s school feeding programme. Potentially this could be leveraged to study effects on MH and SWB. Similarly for programmes in Chinga (Luo et al., 2012; Fang and Zhu et al., 2022) including a long-term follow-up of Liu et al. (2019).